empty
09.01.2024 07:10 AM
Trading Signals for Bitcoin (BTC/USD) on January 9-12, 2024: sell below $47,300 (6/8 Murray - overbought)

This image is no longer relevant

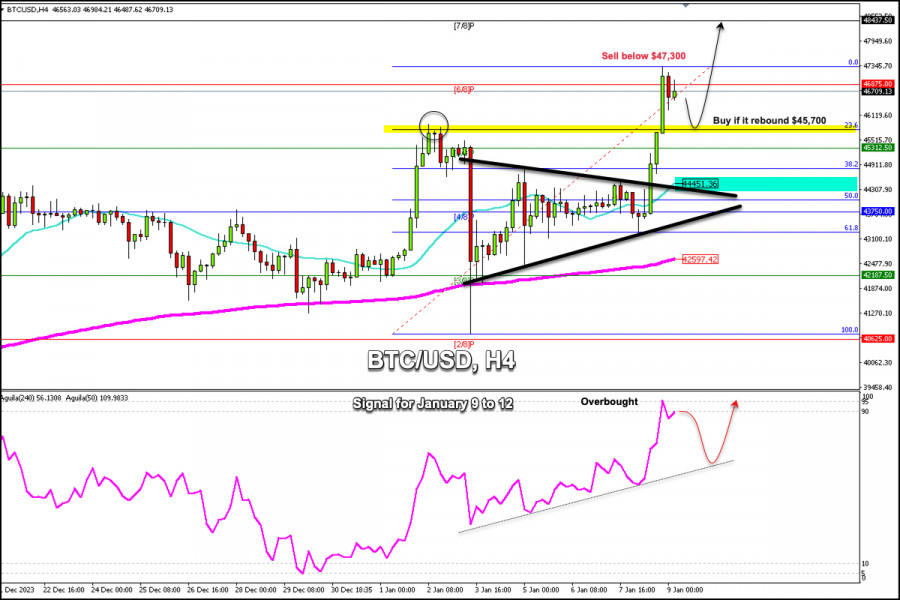
Early in the Asian session, we can observe that Bitcoin is trading around $46,756, below 6/8 Murray which represents a strong resistance, and above the 21 SMA located at $44,451.

In the last few hours, we observed on the chart that Bitcoin broke sharply the symmetrical triangle pattern formed since early January. BTC rose rapidly after consolidating above the 21 SMA and breaking the technical pattern and thus reached its high of this year for now around 47,299.52.

Before opening today, Bitcoin was trading at about 43,270. In less than 24 hours, it reached the 47,000 level, this area was last seen in May 2022. Therefore, Bitcoin gained more than 6.83%.

The optimistic catalyst for the strong demand for Bitcoin is good progress towards a BTC spot ETF market. This is generating strong optimism among crypto investors. So, if this trend continues in the coming days, the token could reach 7/8 Murray located at 48,437 and even the psychological level of $50,000.

On the other hand, technically, the eagle indicator has approached an extremely overbought zone. If Bitcoin trades below 6/8 Murray or below its high of 47,300, we could expect a technical correction towards the 23.6% Fibonacci retracement located at $45,600.

If a technical correction scenario occurs, it could favor the bulls and Bitcoin could gain momentum and could reach new highs and even exceed the psychological $50,000 level.

As long as the Bitcoin trades above the 200 EMA (42,597) and above the 21 SMA (45,700), the outlook will remain positive for the Bitcoin and any pullback towards these areas could be seen as an opportunity to resume buying.

In case Bitcoin falls around the 50% Fibonacci retracement, the level that coincides with the 21 SMA and also with the symmetrical triangle pattern that was broken, it could provide a strong technical bounce around this area and we could consider buying.

Dimitrios Zappas,
InstaForex के विश्लेषणात्मक विशेषज्ञ
© 2007-2025
Summary
Urgency
Analytic
Dimitrios Zappas
Start trade
Earn on cryptocurrency rate changes with InstaForex
Download MetaTrader 4 and open your first trade
  • Grand Choice
    Contest by
    InstaForex
    InstaForex always strives to help you
    fulfill your biggest dreams.
    कॉन्टेस्ट में हिस्सा लें

अनुशंसित लेख

EUR/USD – 29 जुलाई. स्मार्ट मनी सिस्टम विश्लेषण

हम एक मज़बूत तेज़ी का रुझान देख रहे हैं, जिसके खत्म होने के कोई संकेत नहीं दिख रहे हैं। इसे अभी भी पूरा मानने का कोई कारण नहीं है। मैं

Samir Klishi 19:31 2025-07-29 UTC+2

29 जुलाई, 2025 को EUR/USD का पूर्वानुमान

सोमवार को, EUR/USD जोड़ी ने अमेरिकी डॉलर के पक्ष में रुख पलट दिया और 1.1574 पर 100.0% फिबोनाची रिट्रेसमेंट स्तर की ओर तीव्र गिरावट दर्ज की। निस्संदेह, समाचार पृष्ठभूमि के

Samir Klishi 19:31 2025-07-29 UTC+2

24 जुलाई, 2025 को EUR/USD का पूर्वानुमान

बुधवार को, EUR/USD जोड़ी 1.1712 पर 127.2% फिबोनाची रिट्रेसमेंट स्तर से उछली, यूरो के पक्ष में पलटी, और 1.1802 के स्तर की ओर बढ़ती रही। 1.1802 से उछाल अमेरिकी डॉलर

Samir Klishi 19:49 2025-07-24 UTC+2

24 जुलाई, 2025 को GBP/USD का पूर्वानुमान

प्रति घंटा चार्ट पर, GBP/USD जोड़ी बुधवार को 1.3530 पर 61.8% फिबोनाची रिट्रेसमेंट स्तर से ऊपर समेकित हुई और 1.3579 पर 50.0% के स्तर तक पहुँच गई। आज, इस स्तर

Samir Klishi 19:46 2025-07-24 UTC+2

24 से 27 जुलाई, 2025 के लिए बिटकॉइन के ट्रेडिंग सिग्नल: $117,000 के ऊपर खरीदें (6/8 मरे - 21 SMA)।

ईगल इंडिकेटर 21 जुलाई से सकारात्मक संकेत दिखा रहा है। संभावना है कि आने वाले दिनों में बिटकॉइन में कोई भी वापसी खरीदारी जारी रखने के लिए संकेत के रूप

Dimitrios Zappas 09:42 2025-07-24 UTC+2

यदि S&P 500 इंडेक्स का सपोर्ट स्तर 6327.24 आज के नीचे की ओर सुधार को सहन कर लेता है, तो यह फिर से मजबूती की ओर ले जाएगा। गुरुवार, 24 जुलाई, 2025।

S&P 500 इंडेक्स – गुरुवार, 24 जुलाई, 2025। गोल्डन क्रॉस EMA(50) के EMA(200) के ऊपर होने के कारण खरीदार काफी हावी हैं। हालांकि RSI(14) संकेतक एक तटस्थ तेजी के स्तर

Arief Makmur 09:37 2025-07-24 UTC+2

हालांकि खरीदार अब भी नैस्डैक 100 इंडेक्स पर हावी हैं, लेकिन आज, गुरुवार, 24 जुलाई, 2025 को नीचे की ओर सुधार की संभावना है।

नैस्डैक 100 इंडेक्स – गुरुवार, 24 जुलाई, 2025। नैस्डैक 100 इंडेक्स की कीमत की चाल और RSI(14) इंडिकेटर के बीच विचलन प्रकट होने से संकेत मिलता है कि #NDX के

Arief Makmur 09:32 2025-07-24 UTC+2

AUD/USD के लिए सभी तकनीकी संकेतक स्थिति बुधवार, 23 जुलाई, 2025 को महत्वपूर्ण मजबूती का संकेत देती है।

AUD/USD – बुधवार, 23 जुलाई, 2025. AUD/USD के सभी तकनीकी संकेतक महत्वपूर्ण मजबूती का संकेत दे रहे हैं, जिसमें 50-दिवसीय मूविंग एवरेज (EMA) और 200-दिवसीय मूविंग एवरेज (EMA) का गोल्डन

Arief Makmur 19:58 2025-07-23 UTC+2

USD/JPY की भविष्यवाणी - 23 जुलाई, 2025

आज सुबह, कीमत 146.29 के समर्थन स्तर तक पहुंची और निर्णायक रूप से ऊपर की ओर मुड़ी। यह देखना बाकी है कि क्या यह दृढ़ता 148.66 को तोड़ने के लिए

Laurie Bailey 07:20 2025-07-23 UTC+2

GBP/USD – 22 जुलाई: पाउंड ने मंदी का रुख तोड़ा

प्रति घंटा चार्ट पर, GBP/USD जोड़ी ने सोमवार को पाउंड के पक्ष में एक नया उलटफेर किया और 76.4% फिबोनाची स्तर से ऊपर 1.3470 पर समेकित हुई, जिससे पिछले दो

Samir Klishi 19:19 2025-07-22 UTC+2
अभी बात नहीं कर सकते?
अपना प्रश्न पूछें बातचीत.
Widget callback