empty
12.03.2025 02:34 PM
EUR/USD. March 12th. The U.S.-Canada Trade War in Full Swing

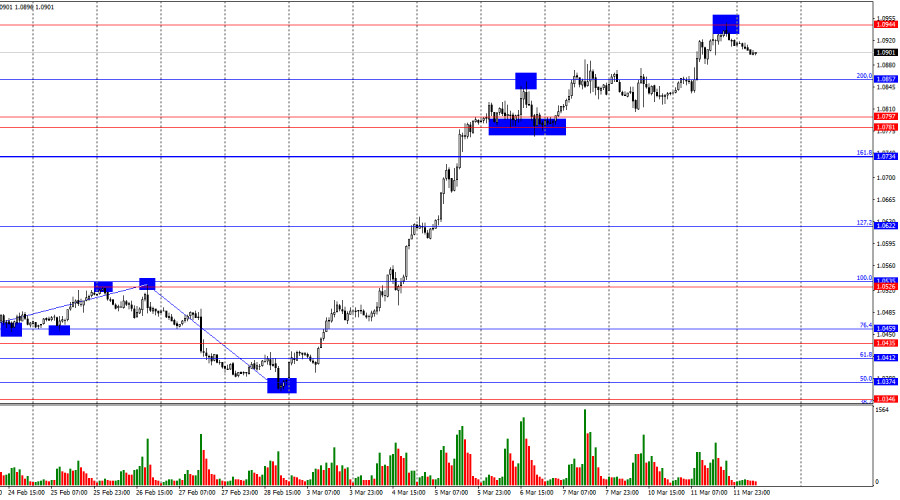
On Tuesday, the EUR/USD pair secured itself above the 200.0% corrective level at 1.0857 and continued rising towards 1.0944, which bulls successfully reached by the end of the day. A rebound from this level favored the U.S. dollar, but who still believes in the greenback's strength? A decline towards 1.0857 is possible, but closing above 1.0944 will increase the likelihood of further euro appreciation towards the next Fibonacci level of 261.8% at 1.1056.

This image is no longer relevant

The wave situation on the hourly chart has changed. The last completed downward wave broke the low of the previous wave, while the new upward wave broke the previous peak. Thus, the current wave structure indicates a "bullish" trend. However, this growth is impulsive, driven by fears of a U.S. economic slowdown amid Trump's policies. This factor alone has been almost the sole driver of the dollar's recent decline.

Tuesday's economic data provided limited support for the U.S. dollar. However, the only noteworthy report of the day, the JOLTS job openings report, was largely ignored by bearish traders. Job openings in the U.S. in January amounted to 7.74 million, surpassing December's 7.508 million and exceeding traders' expectations of 7.63 million. Nevertheless, the dollar failed to benefit from this report. The market continued selling the greenback amid escalating tensions between Canada and the U.S. In Canada, officials unexpectedly decided that tariffs should be met with counter-tariffs, catching Trump off guard. Since Canadian leadership, under the familiar face of Mark Carney, decided to retaliate, Trump swiftly imposed additional tariffs, raising import duties on steel and aluminum by another 25%. Interestingly, Trump labeled Canada's increased electricity tariffs as "unjustified," asserting that only he has the right to impose tariffs.

This image is no longer relevant

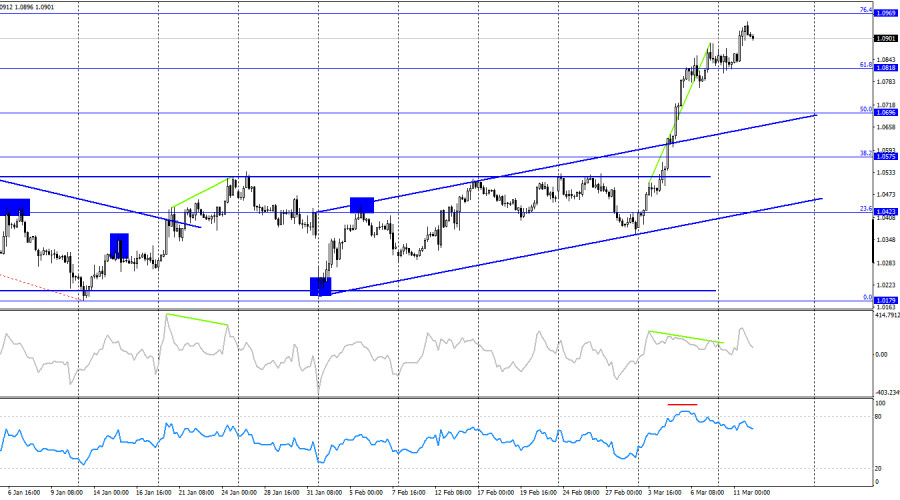
On the four-hour chart, the pair continues its uptrend after breaking above the horizontal channel. The trend remains "bullish," as indicated by the ascending trend corridor. Securing the pair above the 61.8% Fibonacci level at 1.0818 suggests further growth towards the next resistance at 76.4% Fibonacci at 1.0969. A "bearish" divergence in the CCI indicator and overbought conditions in the RSI signaled a potential price drop, but bears failed to act. A rebound from 1.0969 could trigger a decline toward 1.0818.

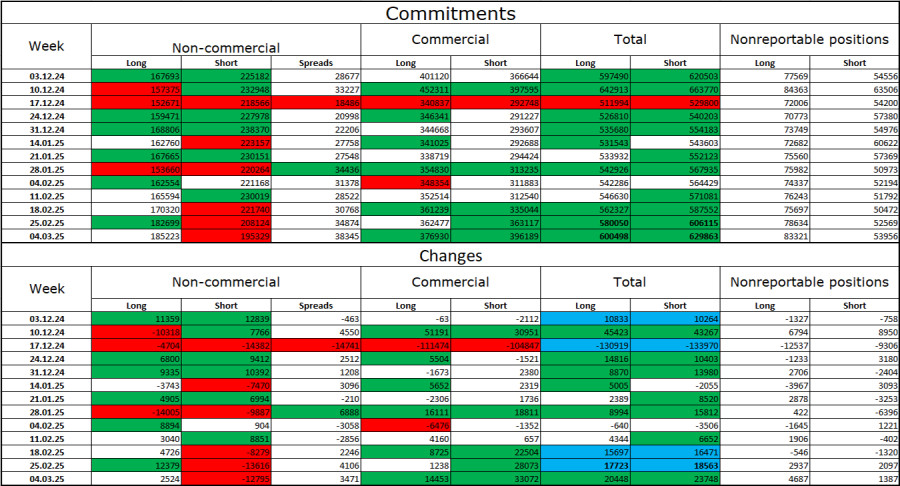
Commitments of Traders (COT) Report:

This image is no longer relevant

Over the past reporting week, professional traders opened 2,524 new long positions and closed 12,795 short positions. The sentiment among the "Non-commercial" group remains "bearish" but has weakened recently. The total number of long positions held by speculators now stands at 185,000, while short positions amount to 195,000.

For twenty consecutive weeks, large market players have been reducing their euro holdings, indicating a sustained "bearish" trend. The divergence in monetary policy between the ECB and the Fed continues to favor the U.S. dollar. While the "bearish" advantage is beginning to fade, it is still too early to declare the end of the downtrend. The number of long positions has been rising for five weeks straight, coinciding with Donald Trump's presidency.

News Calendar for the U.S. and the Eurozone:

Eurozone – ECB President Christine Lagarde's Speech (08:45 UTC). U.S. – Consumer Price Index (12:30 UTC).

On March 12, the economic calendar contains two significant events. Market sentiment on Wednesday could be strongly influenced by these data releases.

EUR/USD Forecast and Trading Recommendations:

Selling the pair is possible upon a rebound from 1.0944 on the hourly chart, with targets at 1.0857 and 1.0797. However, who is selling in this market right now? Buying could be considered, but the strong and uninterrupted rally in the pair remains concerning. I remain cautious when prices move in only one direction.

Fibonacci levels are plotted from 1.0529–1.0213 on the hourly chart and from 1.1214–1.0179 on the four-hour chart.

Samir Klishi,
انسٹافاریکس کا تجزیاتی ماہر
© 2007-2025
ٹائم فریم منتخب کریں
5
منٹ
15
منٹ
30
منٹ
1
گھنٹہ
4
گھنٹے
1
دن
1
ہفتہ
انسٹافاریکس کے ساتھ کرپٹو کرنسی کی معاملاتی تبدیلیوں سے کمائیں۔
میٹا ٹریڈر 4 ڈاؤن لوڈ کریں اور اپنی پہلی ٹریڈ کھولیں۔
  • Grand Choice
    Contest by
    InstaForex
    InstaForex always strives to help you
    fulfill your biggest dreams.
    مقابلہ میں شامل ہوں

تجویز کردہ مضامین

این ذیڈ ڈی / یوایس ڈی : تجزیہ اور پیشن گوئی

آج این ذیڈ ڈی / یو ایس ڈی پئیر خریداروں کو اپنی طرف متوجہ کرتا ہے، حالانکہ یہ اب بھی 0.6050 کی سطح سے نیچے ہے۔ تمام ٹائم فریموں

Irina Yanina 17:45 2025-06-05 UTC+2

یورو / یو ایس ڈی کی پیشن گوئی برائے 04 جون 2025

منگل کو، یورو / یو ایس ڈی پئیر 1.1454 پر 76.4% ریٹریسمنٹ لیول سے ریباؤنڈ ہوا، امریکی ڈالر کے حق میں پلٹ گیا، اور نیچے کی طرف حرکت شروع

Samir Klishi 21:44 2025-06-04 UTC+2

جی بی پی / جے پی وائے. تجزیہ اور پیشن گوئی

جی بی پی / جے پی وائے پئیر لگاتار دوسرے دن مثبت رفتار حاصل کر رہا ہے۔ تکنیکی نقطہ نظر سے، جی بی پی / جے پی وائے

Irina Yanina 21:39 2025-06-04 UTC+2

جون 03 2025 کو جی بی پی / یو ایس ڈی کی پیشن گوئی

فی گھنٹہ چارٹ پر، پیر کو جی بی پی / یو ایس ڈی پئیر 1.3520 پر 161.8% ریٹریسمنٹ لیول سے اوپر مضبوط ہوا۔ اس طرح، پاؤنڈ کی اوپر کی حرکت

Samir Klishi 16:08 2025-06-03 UTC+2

یورو / یو ایس ڈی 3 جون۔ ای یو افراط زر کے اعداد و شمار کا انتظار ہے۔

پیر کو، یورو / یو ایس ڈی پئیر 1.1374–1.1380 زون کے اوپر مضبوط ہوا اور 1.1454 پر 76.4% ریٹریسمنٹ لیول تک بڑھ گیا۔ اس سطح سے واپسی نے امریکی ڈالر

Samir Klishi 14:34 2025-06-03 UTC+2

جون 2-5 2025 کے لیے سونے (ایکس اے یو / یو ایس ڈی) کے لیے تجارتی سگنل: $3,3802 سے نیچے فروخت (21 ایس ایم اے - 6/8 مرے)

اس ہفتے کے تجارتی سیشن کے آغاز پر، سونے نے 3,289 کے ارد گرد ایک گیپ چھوڑا، اور امکان ہے کہ آنے والے دنوں میں یہ خلا پُر ہو جائے

Dimitrios Zappas 21:21 2025-06-02 UTC+2

جون 2-5 2025 کے لیے یورو / یو ایس ڈی کے لیے تجارتی اشارہ : 1.1474 سے نیچے فروخت کریں (21 ایس ایم اے - 6/8 مرے)

اگر تیزی کی قوت غالب رہتی ہے، تو یورو 1.1474 کے ارد گرد اپ ٹرینڈ چینل کے اوپر اور یہاں تک کہ 1.1500 کی نفسیاتی سطح تک پہنچ سکتا ہے۔

Dimitrios Zappas 21:19 2025-06-02 UTC+2

چاندی : تجزیہ اور پیشن گوئی

آج، نئے ہفتے کے آغاز پر، چاندی بڑھ رہی ہے، نفسیاتی $33.00 کی سطح سے اوپر آ رہی ہے اور جمعہ کے نقصانات کا کچھ حصہ پورا کر رہی ہے۔

Irina Yanina 21:13 2025-06-02 UTC+2

جی بی پی / یو ایس ڈی ۔ تجزیہ اور پیشن گوئی

جی بی پی / یو ایس ڈی پئیر امریکی ڈالر میں معمولی اضافے کے درمیان، 1.3415 کی سطح سے اپنی حالیہ بحالی کے بعد نئے فروخت کنندگان کو راغب

Irina Yanina 17:03 2025-05-30 UTC+2

مئی 29-30 2025 کے لیے یورو / یو ایس ڈی کے لیے تجارتی سگنل: 1.1360 سے نیچے فروخت کریں (21 ایس ایم اے - 5/8 مرے)

یورو آنے والے گھنٹوں میں بڑھ سکتا ہے، لیکن اسے 1.1352 کے ارد گرد مضبوط ریزسٹنس کا سامنا ہے۔ یہ سطح فروخت کو دوبارہ شروع کرنے کا ایک اہم موقع

Dimitrios Zappas 19:11 2025-05-29 UTC+2
ابھی فوری بات نہیں کرسکتے ؟
اپنا سوال پوچھیں بذریعہ چیٹ.
Widget callback
 

Dear visitor,

Your IP address shows that you are currently located in the USA. If you are a resident of the United States, you are prohibited from using the services of InstaFintech Group including online trading, online transfers, deposit/withdrawal of funds, etc.

If you think you are seeing this message by mistake and your location is not the US, kindly proceed to the website. Otherwise, you must leave the website in order to comply with government restrictions.

Why does your IP address show your location as the USA?

  • - you are using a VPN provided by a hosting company based in the United States;
  • - your IP does not have proper WHOIS records;
  • - an error occurred in the WHOIS geolocation database.

Please confirm whether you are a US resident or not by clicking the relevant button below. If you choose the wrong option, being a US resident, you will not be able to open an account with InstaForex anyway.

We are sorry for any inconvenience caused by this message.