empty
was formed on 02.06 at 16:03:51 (UTC+0)
signal strength 5 of 5
Bearish Rectangle #PEP D1

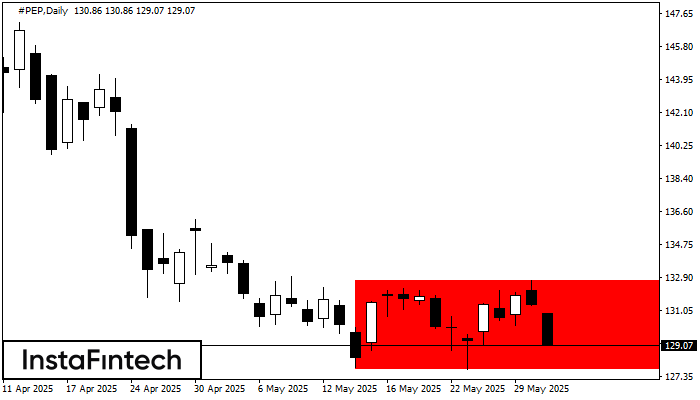
According to the chart of D1, #PEP formed the Bearish Rectangle. This type of a pattern indicates a trend continuation. It consists of two levels: resistance 132.70 - 0.00 and support 127.74 – 127.74. In case the resistance level 127.74 - 127.74 is broken, the instrument is likely to follow the bearish trend.

یہ بھی دیکھیں

Figure
  • All
  • Double Top
  • Flag
  • Head and Shoulders
  • Pennant
  • Rectangle
  • Triangle
  • Triple top
Instrument
  • All
  • #AAPL
  • #AMZN
  • #Bitcoin
  • #EBAY
  • #FB
  • #GOOG
  • #INTC
  • #KO
  • #MA
  • #MCD
  • #MSFT
  • #NTDOY
  • #PEP
  • #TSLA
  • #TWTR
  • AUDCAD
  • AUDCHF
  • AUDJPY
  • AUDUSD
  • EURCAD
  • EURCHF
  • EURGBP
  • EURJPY
  • EURNZD
  • EURRUB
  • EURUSD
  • GBPAUD
  • GBPCHF
  • GBPJPY
  • GBPUSD
  • GOLD
  • NZDCAD
  • NZDCHF
  • NZDJPY
  • NZDUSD
  • SILVER
  • USDCAD
  • USDCHF
  • USDJPY
  • USDRUB
Timeframe
  • All
  • M5
  • M15
  • M30
  • H1
  • D1
Trend
  • All
  • Buy
  • Sale
Signal Strength
  • All
  • 1
  • 2
  • 3
  • 4
  • 5
รูปแบบกราฟสี่เหลี่ยมผืนผ้าขาลง (Bearish Rectangle) #PEP M5

อ้างอิงจากชาร์ตของ M5, #PEP ที่ได้สร้างรูปแบบ รูปแบบกราฟสี่เหลี่ยมผืนผ้าขาลง (Bearish Rectangle) ออกมา รูปแบบประเภทนี้แสดงถึง ความต่อเนื่องในแนวโน้ม มันประกอบไปด้วยสองระดับ: แนวต้าน 133.83 - 0.00

ขอบเตระยะเวลาใน M5 และ M15 อาจจะมีตำแหน่งการเข้าใช้งานที่ผิดพลาดมากยิ่งขึ้น

Open chart in a new window
รูปแบบกราฟสี่เหลี่ยมผืนผ้าขาลง (Bearish Rectangle) #PEP M5

อ้างอิงจากชาร์ตของ M5, #PEP ที่ได้สร้างรูปแบบ รูปแบบกราฟสี่เหลี่ยมผืนผ้าขาลง (Bearish Rectangle) ออกมา รูปแบบนี้แสดงถึง ความต่อเนื่องในแนวโน้ม ขอบเขตด้านบนคือ 133.83 ส่วนขอบเขตด้านล่างคือ 132.94 สัญญาณนี้แสดงถึง

ขอบเตระยะเวลาใน M5 และ M15 อาจจะมีตำแหน่งการเข้าใช้งานที่ผิดพลาดมากยิ่งขึ้น

Open chart in a new window
รูปแบบกราฟจุดสามยอดขาลง (Triple Bottom)
was formed on 09.07 at 18:20:21 (UTC+0)
signal strength 1 of 5
รูปแบบกราฟจุดสามยอดขาลง (Triple Bottom) #TSLA M5

รูปแบบ รูปแบบกราฟจุดสามยอดขาลง (Triple Bottom) ได้สร้างขึ้นมาในชาร์ตของ #TSLA M5 ลักษณะของกราฟรูปแบบนี้: เส้นด้านล่างของกราฟรูปแบบนี้มีพิกัดอยู่ที่ 299.81 พร้อมกับลิมิตด้านบน 299.81/296.14,ระยะของความกว้างคือ 563 จุด การก่อตัวของกราฟรูปแบบ

ขอบเตระยะเวลาใน M5 และ M15 อาจจะมีตำแหน่งการเข้าใช้งานที่ผิดพลาดมากยิ่งขึ้น

Open chart in a new window
ابھی فوری بات نہیں کرسکتے ؟
اپنا سوال پوچھیں بذریعہ چیٹ.
Widget callback
 

Dear visitor,

Your IP address shows that you are currently located in the USA. If you are a resident of the United States, you are prohibited from using the services of InstaFintech Group including online trading, online transfers, deposit/withdrawal of funds, etc.

If you think you are seeing this message by mistake and your location is not the US, kindly proceed to the website. Otherwise, you must leave the website in order to comply with government restrictions.

Why does your IP address show your location as the USA?

  • - you are using a VPN provided by a hosting company based in the United States;
  • - your IP does not have proper WHOIS records;
  • - an error occurred in the WHOIS geolocation database.

Please confirm whether you are a US resident or not by clicking the relevant button below. If you choose the wrong option, being a US resident, you will not be able to open an account with InstaForex anyway.

We are sorry for any inconvenience caused by this message.