Condiciones de negociación
Products
Herramientas
Data on durable goods orders in the United States declined 5.4% in October, while the forecast predicted a drop of only 2.8%. The negative impact was slightly mitigated by data on jobless claims in the U.S., which reflected a decrease in their overall volume despite the forecast of an increase. Statistical details indicate that the volume of continuing claims fell from 1.862 million to 1.840 million, while the volume of initial claims rose from 233,000 to 209,000.
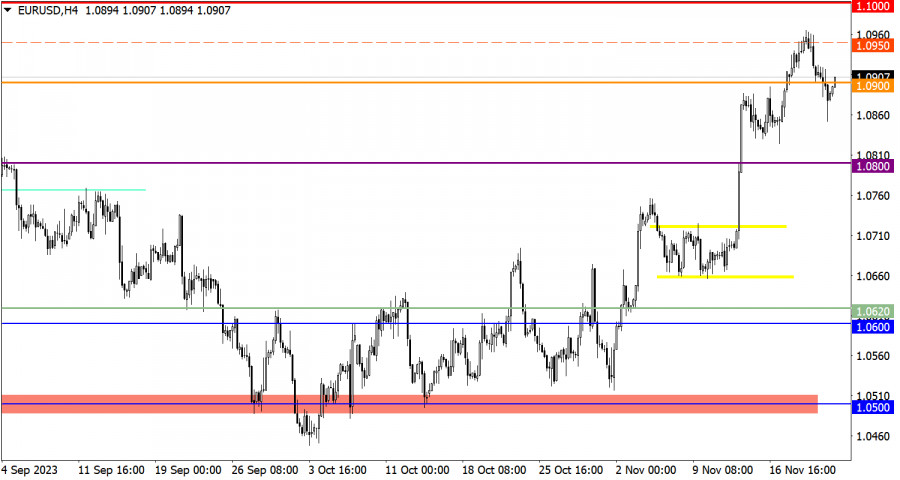
During the corrective movement, the EUR/USD currency pair almost reached the level of 1.0850. This movement was characterized in the market as local, after which the quote returned above the level of 1.0900.
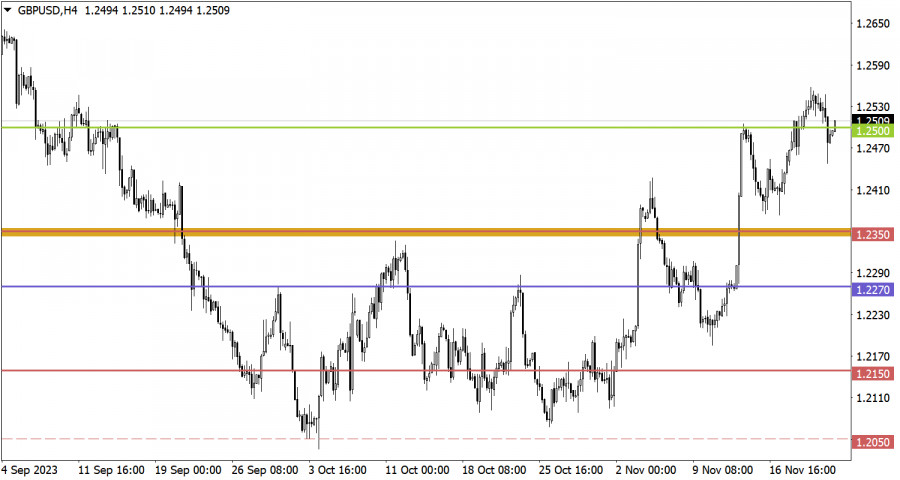
The GBP/USD pair temporarily dropped below the level of 1.2450 during a technical pullback, but then returned to the area around the level of 1.2500. The current pullback fits into the structure of an upward cycle, and no shifts in trading interests are observed.
The publication of preliminary estimates for business activity indices in the United Kingdom and the United States is expected. Despite the importance of this event for the market, it is likely to go unnoticed. Today is a holiday in the United States due to Thanksgiving Day, which, in turn, will lead to a decrease in trading volumes.
Price stabilization above the level of 1.0900 may indicate a possible increase in the volume of long positions, paving the way to the level of 1.1000. On the other hand, holding the price below the level of 1.0850 may lead to an extension of the corrective cycle.
Maintaining the price above the level of 1.2500 may subsequently indicate an increase in the volume of long positions. In this case, an update of the local high within the upward cycle is possible. As for the pullback scenario, it may be relevant if the price remains below the level of 1.2450.
The candlestick chart type is white and black graphic rectangles with lines above and below. With a detailed analysis of each individual candle, you can see its characteristics relative to a particular time frame: opening price, closing price, intraday high and low.
Horizontal levels are price coordinates, relative to which a price may stop or reverse its trajectory. In the market, these levels are called support and resistance.
Circles and rectangles are highlighted examples where the price reversed in history. This color highlighting indicates horizontal lines that may put pressure on the asset's price in the future.
The up/down arrows are landmarks of the possible price direction in the future.
¡Los informes analíticos de InstaForex lo mantendrá bien informado de las tendencias del mercado! Al ser un cliente de InstaForex, se le proporciona una gran cantidad de servicios gratuitos para una operación eficiente.
Podemos utilizar cookies para analizar los datos de nuestros visitantes, mejorar nuestro sitio web y medir el rendimiento de la publicidad. En general, estos datos se utilizan para ofrecer una mejor experiencia en el sitio web. Más información.
Your IP address shows that you are currently located in the USA. If you are a resident of the United States, you are prohibited from using the services of Instant Trading EU Ltd including online trading, online transfers, deposit/withdrawal of funds, etc.
If you think you are seeing this message by mistake and your location is not the US, kindly proceed to the website. Otherwise, you must leave the website in order to comply with government restrictions.
Why does your IP address show your location as the USA?
Please confirm whether you are a US resident or not by clicking the relevant button below. If you choose the wrong option, being a US resident, you will not be able to open an account with InstaForex anyway.
We are sorry for any inconvenience caused by this message.