GBP/USD
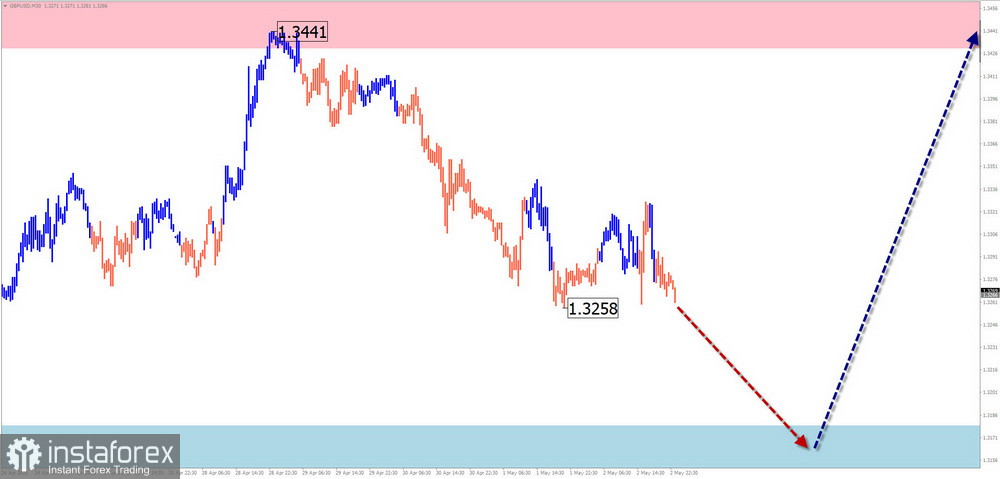
Analysis: The 4-hour chart of the British pound shows that a temporary corrective flat is forming within the dominant upward wave observed in recent weeks. The unfinished upward segment started on April 28. The calculated support lies along the upper boundary of a broad potential reversal zone on the daily timeframe.
Forecast: In the upcoming week, a generally sideways price movement is expected. A decline toward the support zone is likely in the coming days, followed by a drift phase and a potential reversal into an upward trend. The highest volatility is expected toward the end of the week.
Potential Reversal Zones:
- Resistance: 1.3430 / 1.3480
- Support: 1.3180 / 1.3130
Recommendations:
- Selling: Small intraday volumes may be profitable.
- Buying: Not advised until confirmed reversal signals appear near the support zone.
AUD/USD
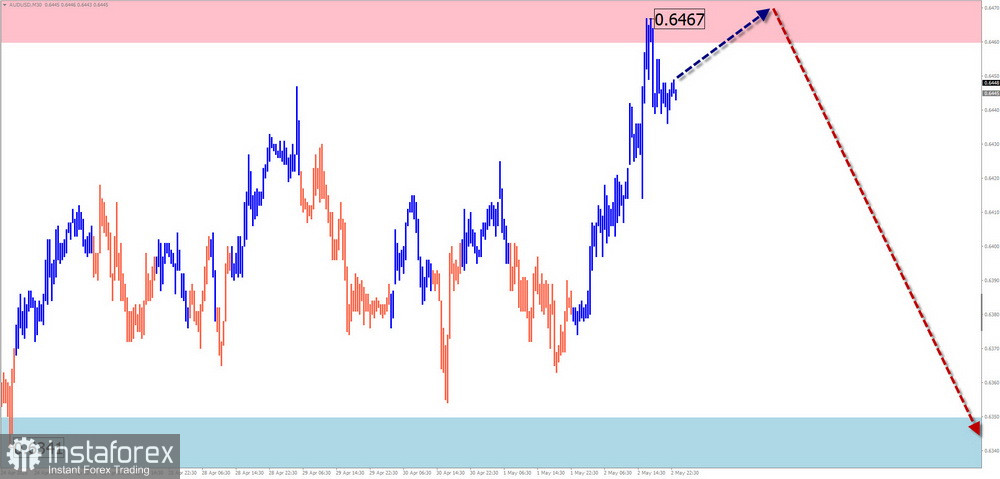
Analysis: Since April 9, a bearish wave structure has been unfolding on the Australian dollar's main pair, and it remains incomplete. Since mid-April, price has entered a sideways correction. The structure is currently unfinished, with quotes confined to a narrow range between strong opposing zones of the higher timeframe.
Forecast: This week may see the end of the upward move and a price shift downward. A sideways movement along the upper boundary is likely, with increased activity and a potential bearish reversal expected toward the week's end.
Potential Reversal Zones:
- Resistance: 0.6460 / 0.6510
- Support: 0.6350 / 0.6300
Recommendations:
- Buying: High risk, low potential.
- Selling: May be used once confirmed reversal signals appear near resistance.
USD/CHF
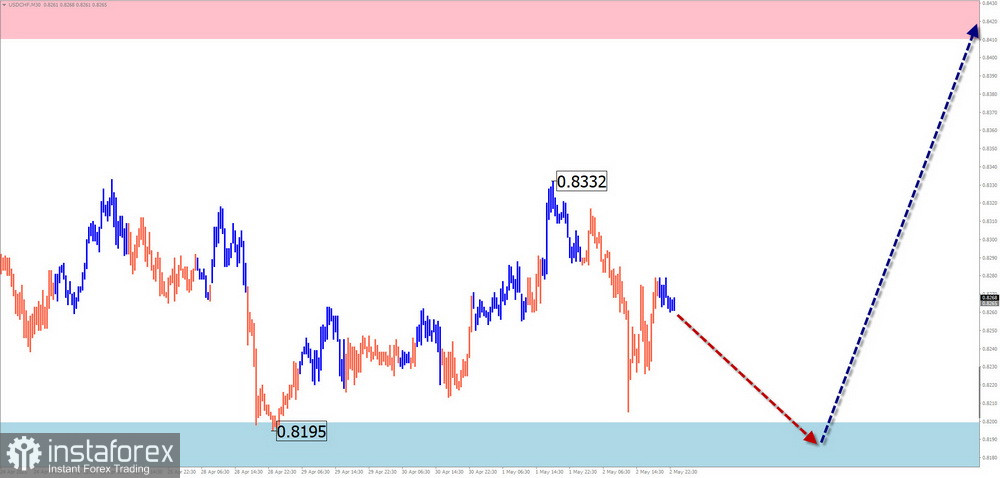
Analysis: The bearish wave that began in January remains the main trend direction for the Swiss franc pair. Over the past three weeks, a counter-wave correction has been forming from a potential reversal zone. The wave level suggests a full correction is underway.
Forecast: The bearish trend is likely to shift into a sideways phase in the near term. A breakout below the calculated support zone this week is unlikely. An increase in buying activity and a price rebound is more likely toward the end of the week.
Potential Reversal Zones:
- Resistance: 0.8410 / 0.8460
- Support: 0.8200 / 0.8150
Recommendations:
- Selling: Low potential—limit to short sessions and small volume sizes.
- Buying: May be considered after reversal signals appear near support using your trading systems (TS).
EUR/JPY
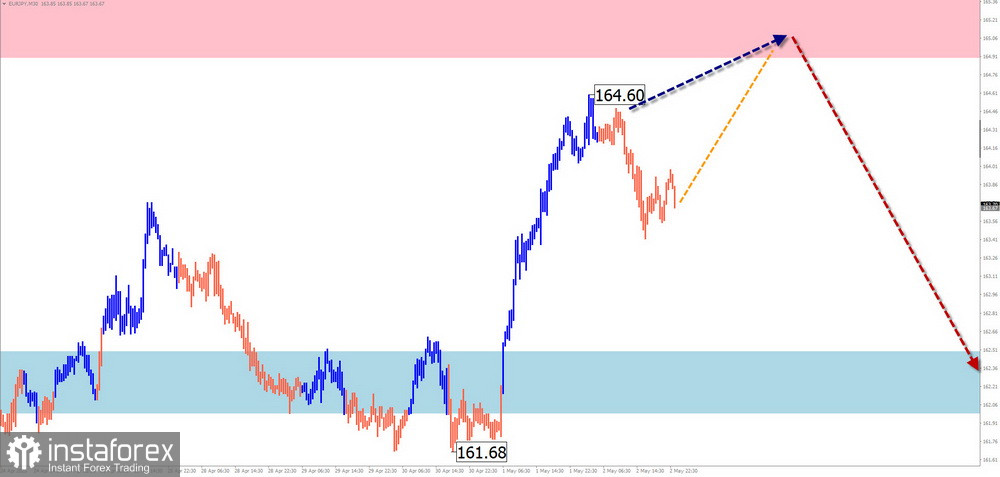
Analysis: A bullish wave that started in February is the current wave structure for the EUR/JPY cross. Since March, a correction has developed from the strong resistance zone, forming a flattening structure. The wave is incomplete at the time of analysis.
Forecast: Price is expected to stay within the existing channel boundaries. Early in the week, sideways movement along the resistance zone is likely. A downward reversal is expected no earlier than Wednesday or Thursday. A breakout beyond the current price channel is unlikely this week.
Potential Reversal Zones:
- Resistance: 164.90 / 165.40
- Support: 162.50 / 162.00
Recommendations:
- Selling: Could be profitable after confirmed signals near resistance.
- Buying: Risky with limited potential.
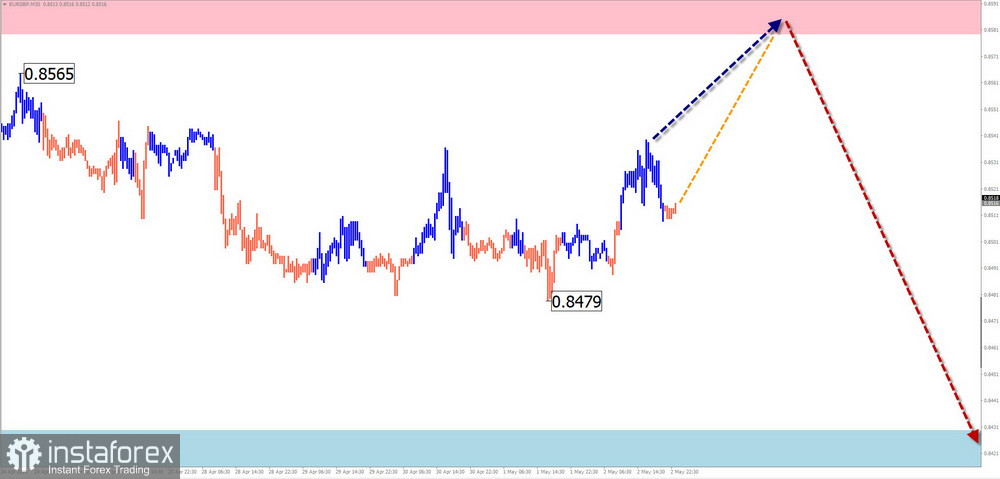
EUR/GBP
Analysis: Since late September, EUR/GBP formed an extended upward wave. On April 11, a bearish reversal leg began. The past two weeks have shown a drifting correction to the initial bearish impulse.
Forecast: A sideways trend is likely in the coming days, with a potential rise to the calculated resistance zone. Pressure on the upper boundary may persist. Volatility is expected to increase later in the week, followed by a reversal and renewed decline.
Potential Reversal Zones:
- Resistance: 0.8580 / 0.8630
- Support: 0.8430 / 0.8380
Recommendations:
- Buying: Intraday use with small volumes permitted.
- Selling: May be used after reversal signals appear near support on your trading systems.
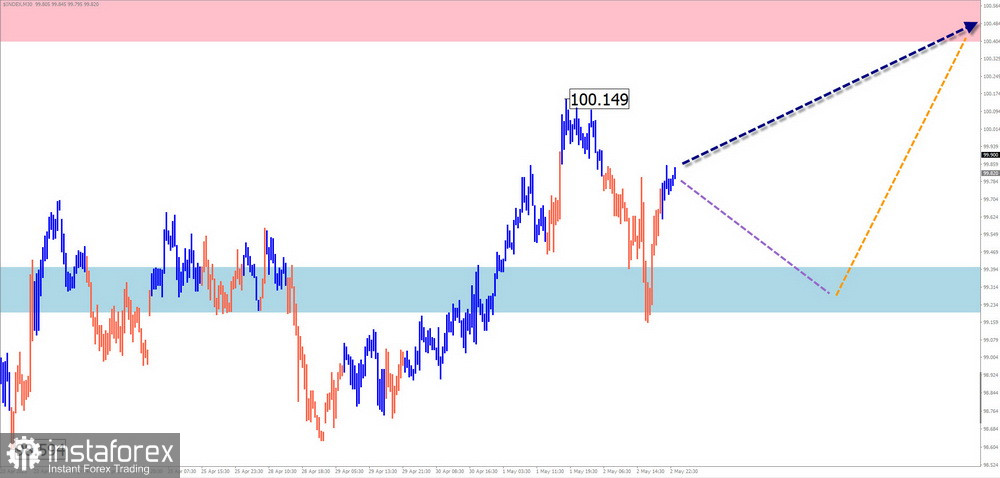
US Dollar Index
Analysis: The U.S. dollar's position against other currencies has weakened since February. The index reached the upper boundary of a weekly potential reversal zone. Since April 11, a correction has been forming, and the C-leg of this wave is currently developing.
Forecast: The dollar index is likely to continue its upward movement. A temporary pullback to the support zone may occur in the early part of the week, followed by increased volatility and a renewed uptrend.
Potential Reversal Zones:
- Resistance: 100.40 / 100.60
- Support: 99.40 / 99.20
Recommendations: Strengthening of the U.S. dollar may trigger a short-term decline in major national currencies. However, this trend is expected to be temporary.
Notes on Simplified Wave Analysis (SWA):
In SWA, all waves consist of 3 segments (A-B-C). Each timeframe focuses only on the latest, unfinished wave. Dashed lines indicate projected movements.
Caution: The wave algorithm does not take into account the duration of price movements!