signal strength 1 of 5
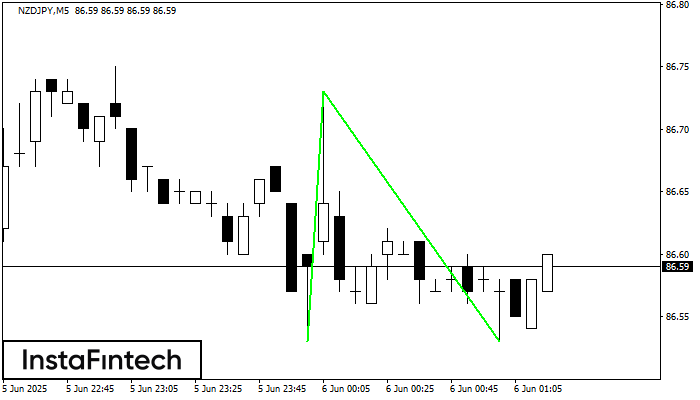
The Double Bottom pattern has been formed on NZDJPY M5; the upper boundary is 86.73; the lower boundary is 86.53. The width of the pattern is 20 points. In case of a break of the upper boundary 86.73, a change in the trend can be predicted where the width of the pattern will coincide with the distance to a possible take profit level.
The M5 and M15 time frames may have more false entry points.
- All
- Double Top
- Flag
- Head and Shoulders
- Pennant
- Rectangle
- Triangle
- Triple top
- All
- #AAPL
- #AMZN
- #Bitcoin
- #EBAY
- #FB
- #GOOG
- #INTC
- #KO
- #MA
- #MCD
- #MSFT
- #NTDOY
- #PEP
- #TSLA
- #TWTR
- AUDCAD
- AUDCHF
- AUDJPY
- AUDUSD
- EURCAD
- EURCHF
- EURGBP
- EURJPY
- EURNZD
- EURRUB
- EURUSD
- GBPAUD
- GBPCHF
- GBPJPY
- GBPUSD
- GOLD
- NZDCAD
- NZDCHF
- NZDJPY
- NZDUSD
- SILVER
- USDCAD
- USDCHF
- USDJPY
- USDRUB
- All
- M5
- M15
- M30
- H1
- D1
- All
- Buy
- Sale
- All
- 1
- 2
- 3
- 4
- 5

Pola Bawah Triple telah terbentuk pada GOLD M5. Pola tersebut memiliki karakteristik sebagai berikut: level resistance 3372.86/3370.25; level support 3364.73/3364.26; dengan lebar 813 poin. Jika terjadi pemecahan (breakdown) pada level
Rangka waktu M5 dan M15 mungkin memiliki lebih dari titik entri yang keliru.
Open chart in a new window
Menurut grafik dari M15, #GOOG terbentuk Persegi Bearish. Pola menunjukkan kelanjutan tren. Batas atas adalah 170.41, batas rendah adalah 169.00. Sinyal berarti posisi jual harus dibuka setelah menetapkan harga dibawah
Rangka waktu M5 dan M15 mungkin memiliki lebih dari titik entri yang keliru.
Open chart in a new window
Menurut Grafik dari M5, #TSLA dibentuk pola Segitiga Simetris Bearish. Pola ini mengisyaratkan tren penurunan lebih lanjut jika terdapat batas yang lebih rendah 317.55 ditembus. Disini, sebuah keuntungan hipotetis akan
Rangka waktu M5 dan M15 mungkin memiliki lebih dari titik entri yang keliru.
Open chart in a new window