empty
08.02.2023 08:17 PM
Technical analysis of EUR/USD for February 08, 2023

This image is no longer relevant

Overview:

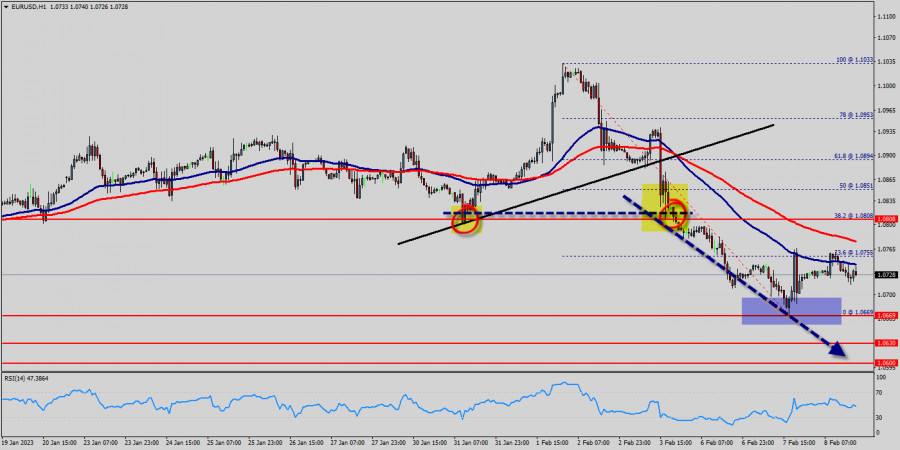
The EUR/USD pair has faced strong resistances at the levels of 1.0880 because support had become resistance last week. So, the strong resistance has been already formed at the level of 1.0880 and the pair is likely to try to approach it in order to test it again. However, if the pair fails to pass through the level of 1.0880, the market will indicate a bearish opportunity below the new strong resistance level of 1.0880 (the level of 1.0880 coincides with a ratio of 38.2% Fibonacci - last bullish wave - double top).

Moreover, the RSI starts signaling a downward trend, as the trend is still showing strength above the moving average (100) and (50). The trend of EUR/USD pair movement was controversial as it took place in the downtrend channel.

Due to the previous events, the price is still set between the levels of 1.0808 and 1.0669, so it is recommended to be careful while making deals in these levels because the prices of 1.0808 and 1.0669 are representing the resistance and support respectively.

Therefore, it is necessary to wait till the downtrend channel is passed through. Then the market will probably show the signs of a bearish market.

It should be noted that the volatility is very high for that the price of the EUR/USD pair is still trading between the prices of 1.0669 and 1.0808 in the coming hours.

Furthermore, the price has been set below the strong resistance at the levels of 1.0808 and 1.0851 which coincide with the 38.2% and 50% Fibonacci retracement levels respectively.

Thus, the market is indicating a bearish opportunity below 1.0808 so it will be good to sell at 1.0808 with the first target of 1.0669.

It will also call for a downtrend in order to continue towards 1.0630. The daily strong support is seen at 1.0600.

However, the stop loss should always be taken into account, for that it will be reasonable to set your stop loss at the level of 1.0851.

Moving averages, in the meantime, maintain their bearish slope way above the current level. Furthermore, although the news is bearish for the EUR/USD pair, professional may not want to sell weakness, but rather following a rebound rally.

Additionally, some aggressive counter-trend buyers may be defending parity. In case a continuousion takes place and the EUR/USD pair breaks through the support level of 1.0669 , a further decline to 1.0600 can occur which would indicate a bearish market.

Signal :

It should be noted that the 1.0808 price will act as a major resistance on Feb. 08th, 2023. Therefore, it will be too gainful to sell short below 1.0808 and look for further downside with 1.0669, 1.0630 and 1.0600 targets. It should also be reminded that stop loss must never exceed the maximum exposure amounts. Thus, stop loss should be placed at the 1.0851 level today.

Summary
Urgency
Analytic
Mourad El Keddani
Start trade
รับผลกำไรจากการเปลี่ยนแปลงอัตราสกุลเงินดิจิทัลกับ InstaForex.
ดาวน์โหลด MetaTrader 4 และเปิดการซื้อขายครั้งแรกของคุณ.
คำแนะนำสำหรับการซื้อขายในตลาดสกุลเงินดิจิทัลประจำวันที่ 11 สิงหาคม บิตคอยน์กำลังมุ่งสู่ระดับสูงสุดใหม่ ขณะนี้ซื้อขายอยู่ที่สูงกว่า $122,000 ในขณะที่ Ethereum ก็เข้าใกล้ระดับสูงสุดเดิมที่เหนือกว่า $4,400 ชี้ให้เห็นว่าตลาดขาขึ้นยังคงดำเนินต่อไป แม้ว่าจะดูเหมือนว่าจะชะลอตัวลงเมื่อสัปดาห์ก่อน หลายคนคาดการณ์ไว้ว่าเดือนสิงหาคมและกันยายน ซึ่งปกติแล้วเป็นช่วงเวลาที่อ่อนแอที่สุดของตลาดสกุลเงินดิจิทัล จะยังคงเหมือนเดิมในปีนี้ และมีเพียงไม่กี่คนที่คาดไว้ถึงการเคลื่อนไหวที่รุนแรงเช่นนี้ อย่างไรก็ตามตรงกันข้ามกับการคาดการณ์ที่มองในแง่ร้าย ตลาดคริปโตกลับแสดงให้เห็นถึงความยืดหยุ่นที่ไม่คาดคิด
  • Chancy Deposit
    ฝากเงินในบัญชีของคุณใน $3,000 และรับ $1000 ไปเพิ่ม!
    ใน สิงหาคม ทางเราได้ออก$1000 ภายในแคมเปญ Chancy Deposit !
    คว้าโอกาสที่จะชนะด้วยการฝากเงิน $3,000 ไปในบัญชีเทรด เมื่อทำตามเงื่อนไขนี้แล้ว คุณก็จะกลายเป็นผู้เข้าร่วมแคมเปญ
    เข้าร่วมการแข่งขัน


บทความแนะนำ

หาก USD/JPY สามารถทะลุระดับ Pivot ได้สำเร็จ ก็มีโอกาสที่จะปรับตัวแข็งแกร่งขึ้นต่อไป วันจันทร์ที่ 11 สิงหาคม 2025

[USD/JPY] – [วันจันทร์ที่ 11 สิงหาคม 2025] แม้ว่าสถานการณ์ของ USD/JPY ยังเคลื่อนไหวในทิศทางด้านข้าง (Sideways) ดังที่ชี้ให้เห็นโดยค่า EMA ที่ซ้อนทับกัน การที่ USD/JPY

Arief Makmur 07:37 2025-08-11 UTC+2

NZD/USD ยังคงมีโอกาสในการแข็งค่าไปยังระดับแนวต้านที่ใกล้ที่สุดได้ต่อไป วันจันทร์ที่ 11 สิงหาคม 2025

[NZD/USD] – [วันจันทร์ที่ 11 สิงหาคม 2025] เมื่อตัวชี้วัดค่าเฉลี่ยเคลื่อนที่เอ็กซ์โพเนนเชียล (EMA) ทั้งสองแนวเกิดเป็น Golden Cross และ RSI(14) อยู่ในระดับ Neutral

Arief Makmur 07:37 2025-08-11 UTC+2

การคาดการณ์ค่าเงิน EUR/USD สำหรับวันที่ 11 สิงหาคม 2025

ยูโรได้ตั้งฐานแน่นยิ่งขึ้นที่ระดับสนับสนุน 1.1632 และยิ่งอยู่ที่นั่นนานเท่าไร ความสมดุลระหว่างโอกาสการเติบโตและการลดลงจะยิ่งชัดเจนยิ่งขึ้น อย่างไรก็ตาม มีสองปัจจัยที่ส่งผลต่อโครงสร้างที่เป็นกลางนี้และเพิ่มโอกาสสำหรับฝั่งหมีอย่างช้าๆ: เส้นเวลา Fibonacci หมายเลข 8 ที่เข้าใกล้มากขึ้นทุกครั้งที่มีแท่งเทียนใหม่ และเครื่องมือ Marlin oscillator ซึ่งเมื่ออยู่ในสถานะที่ราคาขยับด้านข้าง

Laurie Bailey 05:01 2025-08-11 UTC+2

การคาดการณ์ GBP/USD สำหรับวันที่ 11 สิงหาคม 2025

ค่าเงินปอนด์อังกฤษกำลังรวมตัวอยู่ที่จุดสูงสุดซึ่งเพิ่งไปถึงเมื่อเร็วๆ นี้ ที่ระดับการเติบโตระยะสั้นที่ 1.3452 หากมีการยืนยันการทะลุผ่านที่แน่นหนาเหนือระดับนี้ จะเป็นการเปิดทางไปสู่ระดับกลางอีกระดับที่ 1.3525 ซึ่งเป็นจุดต่ำสุดของวันที่ 8 กรกฎาคม ออสซิลเลเตอร์ Marlin ได้ปรับตัวอยู่ในพื้นที่บวก ซึ่งเพิ่มความมั่นใจให้กับนักลงทุนที่มองว่าค่าเงินจะเพิ่มขึ้น อย่างไรก็ตาม

Laurie Bailey 05:01 2025-08-11 UTC+2

พยากรณ์ AUD/USD สำหรับวันที่ 11 สิงหาคม 2025

ดอลลาร์ออสเตรเลียได้มาถึงแนวเส้นดัชนีสมดุลรายวันและเริ่มมีการเคลื่อนไหวเพื่อสร้างสถานะแบบคงที่ ในขณะเดียวกันตัวบ่งชี้ Marlin ก็ได้เคลื่อนไปในโซนบวกและยังคงมีการสร้างสถานะแบบคงที่อยู่ สถานการณ์กำลังก่อตัวขึ้นสำหรับการทะลุขึ้นไปด้วยการโจมตีเป้าหมายแรกบนเส้น MACD ใกล้ระดับ 0.6580 อย่างไรก็ตาม หากเราพิจารณาแผนภูมิ AUD/USD โดยไม่สนใจกรอบเวลาในรายสัปดาห์ เราอาจสรุปได้อย่างผิดพลาด ในแผนภูมิรายสัปดาห์ เราสังเกตเห็นว่าราคาตั้งอยู่ต่ำกว่าระดับเส้น

Laurie Bailey 05:01 2025-08-11 UTC+2

สัญญาณการซื้อขายสำหรับทองคำ (XAU/USD) วันที่ 8-11 สิงหาคม 2025: ขายต่ำกว่าระดับ $3,407 (21 SMA - 7/8 Murray)

ทองคำกำลังซื้อขายอยู่ที่ประมาณ $3,388 และกำลังมีการปรับฐานทางเทคนิคหลังจากพยายามบุกทะลุระดับจิตวิทยาที่ $3,400 ทองคำกำลังพยายามรวมตัวสูงกว่าระดับ 7/8 ของ Murray เนื่องจากกราฟ H4 แสดงให้เห็นว่ามีการปรับฐานทางเทคนิคหลายครั้งใต้บริเวณนี้ การสนับสนุนที่ส่งเสริมให้เครื่องมือนี้ยังคงเดินหน้าต่ออยู่ที่บริเวณประมาณ $3,382 ซึ่งตรงกับตำแหน่งของ 21SMA

Dimitrios Zappas 17:27 2025-08-08 UTC+2

สัญญาณการซื้อขายสำหรับ BITCOIN ระหว่างวันที่ 8-11 สิงหาคม 2025: ขายต่ำกว่า $117,800 (200 EMA - 21 SMA)

หลังจากที่ Bitcoin ขึ้นไปแตะจุดสูงสุดของช่องแนวโน้มขาลงแล้ว ขณะนี้กำลังเผชิญกับการปรับฐานทางเทคนิคและแสดงสัญญาณของความอ่อนแรง เนื่องจากยังไม่สามารถยืนได้เกินแนว 117,900 ดอลลาร์ คาดว่า Bitcoin จะยังคงปรับตัวลดลงต่อไปในชั่วโมงข้างหน้า โดยไปถึงระดับ 5/8 ของ Murray ที่

Dimitrios Zappas 17:25 2025-08-08 UTC+2

USD/JPY: การวิเคราะห์และการคาดการณ์

จากมุมมองด้านเทคนิค ราคาทองคำแกว่งตัวอยู่ในช่วงการซื้อขายรายสัปดาห์ อย่างไรก็ตาม ยังเร็วเกินไปที่จะยืนยันการรวมตัวเป็นขาลงอย่างเต็มที่ เนื่องจากออสซิลเลเตอร์บนกราฟรายวันยังคงอยู่ในพื้นที่บวก การซื้อที่มั่นใจเหนือระดับ 147.60–147.80 อาจนำไปสู่การแข็งค่าขึ้นอีกเหนือระดับสำคัญ 148.00 ผลักให้ USD/JPY เข้าสู่ระดับ 148.50 โมเมนตัมอาจขยายไปสู่ระดับถัดไปที่สำคัญที่ 149.00

Irina Yanina 13:58 2025-08-08 UTC+2

การคาดการณ์สำหรับ EUR/USD วันที่ 8 สิงหาคม 2025

ในวันพฤหัสบดี คู่เงิน EUR/USD ได้ฟื้นตัวจากระดับ 76.4% ของการถอยกลับที่ 1.1695 แล้วกลับตัวเป็นฝั่งเงินดอลลาร์สหรัฐฯ และร่วงลงต่ำกว่ากรอบแนวรับที่ 1.1637–1.1645 วันนี้ การร่วงลงอาจดำเนินต่อไปสู่ระดับ Fibonacci 50.0% ที่

Samir Klishi 11:10 2025-08-08 UTC+2

GBP/USD วันที่ 8 สิงหาคม การตัดสินใจของธนาคารกลางแห่งประเทศอังกฤษทำให้ค่าเงินปอนด์ไม่เปลี่ยนแปลงมากนัก

ในกราฟรายชั่วโมง คู่สกุลเงิน GBP/USD ยังคงมีการเคลื่อนตัวขึ้นในวันพฤหัสบดี และสามารถยืนอยู่เหนือโซนแนวต้านที่ระดับ 1.3357–1.3371 และระดับ 1.3425 ดังนั้น ในวันศุกร์ การเคลื่อนไหวขึ้นอาจดำเนินต่อไปสู่ระดับการหดถอยถัดไปที่ 76.4% ที่ระดับ 1.3470

Samir Klishi 11:02 2025-08-08 UTC+2
หากไม่สะดวกคุยในตอนนี้
ระบุคำถามไว้ได้ใน แชท.
Widget callback
 

Dear visitor,

Your IP address shows that you are currently located in the USA. If you are a resident of the United States, you are prohibited from using the services of InstaFintech Group including online trading, online transfers, deposit/withdrawal of funds, etc.

If you think you are seeing this message by mistake and your location is not the US, kindly proceed to the website. Otherwise, you must leave the website in order to comply with government restrictions.

Why does your IP address show your location as the USA?

  • - you are using a VPN provided by a hosting company based in the United States;
  • - your IP does not have proper WHOIS records;
  • - an error occurred in the WHOIS geolocation database.

Please confirm whether you are a US resident or not by clicking the relevant button below. If you choose the wrong option, being a US resident, you will not be able to open an account with InstaForex anyway.

We are sorry for any inconvenience caused by this message.