empty
08.02.2023 08:17 PM
Technical analysis of EUR/USD for February 08, 2023

This image is no longer relevant

Overview:

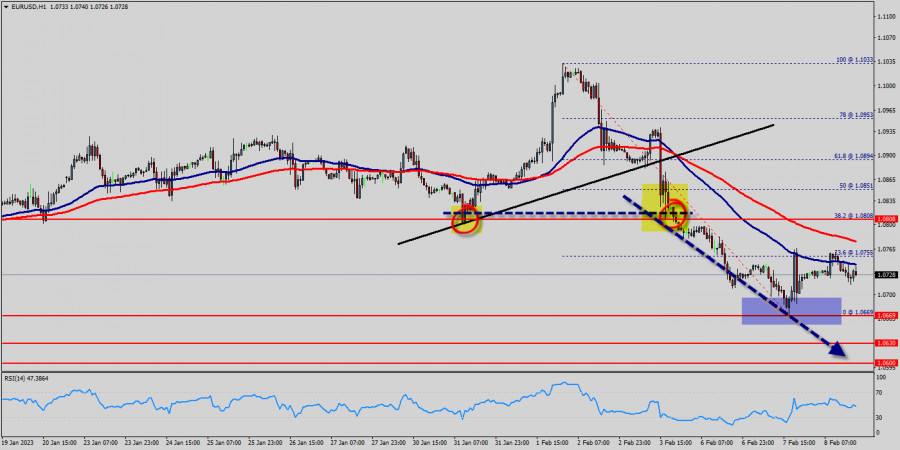
The EUR/USD pair has faced strong resistances at the levels of 1.0880 because support had become resistance last week. So, the strong resistance has been already formed at the level of 1.0880 and the pair is likely to try to approach it in order to test it again. However, if the pair fails to pass through the level of 1.0880, the market will indicate a bearish opportunity below the new strong resistance level of 1.0880 (the level of 1.0880 coincides with a ratio of 38.2% Fibonacci - last bullish wave - double top).

Moreover, the RSI starts signaling a downward trend, as the trend is still showing strength above the moving average (100) and (50). The trend of EUR/USD pair movement was controversial as it took place in the downtrend channel.

Due to the previous events, the price is still set between the levels of 1.0808 and 1.0669, so it is recommended to be careful while making deals in these levels because the prices of 1.0808 and 1.0669 are representing the resistance and support respectively.

Therefore, it is necessary to wait till the downtrend channel is passed through. Then the market will probably show the signs of a bearish market.

It should be noted that the volatility is very high for that the price of the EUR/USD pair is still trading between the prices of 1.0669 and 1.0808 in the coming hours.

Furthermore, the price has been set below the strong resistance at the levels of 1.0808 and 1.0851 which coincide with the 38.2% and 50% Fibonacci retracement levels respectively.

Thus, the market is indicating a bearish opportunity below 1.0808 so it will be good to sell at 1.0808 with the first target of 1.0669.

It will also call for a downtrend in order to continue towards 1.0630. The daily strong support is seen at 1.0600.

However, the stop loss should always be taken into account, for that it will be reasonable to set your stop loss at the level of 1.0851.

Moving averages, in the meantime, maintain their bearish slope way above the current level. Furthermore, although the news is bearish for the EUR/USD pair, professional may not want to sell weakness, but rather following a rebound rally.

Additionally, some aggressive counter-trend buyers may be defending parity. In case a continuousion takes place and the EUR/USD pair breaks through the support level of 1.0669 , a further decline to 1.0600 can occur which would indicate a bearish market.

Signal :

It should be noted that the 1.0808 price will act as a major resistance on Feb. 08th, 2023. Therefore, it will be too gainful to sell short below 1.0808 and look for further downside with 1.0669, 1.0630 and 1.0600 targets. It should also be reminded that stop loss must never exceed the maximum exposure amounts. Thus, stop loss should be placed at the 1.0851 level today.

Summary
Urgency
Analytic
Mourad El Keddani
Start trade
Earn on cryptocurrency rate changes with InstaForex
Download MetaTrader 4 and open your first trade
  • Grand Choice
    Contest by
    InstaForex
    InstaForex always strives to help you
    fulfill your biggest dreams.
    JOIN CONTEST

Recommended Stories

Forex forecast 24/07/2025: EUR/USD, GBP/USD, Gold, Ethereum and Bitcoin

Useful links: My other articles are available in this section InstaForex course for beginners Popular Analytics Open trading account Important: The begginers in forex trading need to be very careful

Sebastian Seliga 12:02 2025-07-24 UTC+2

Forecast for EUR/USD on July 24, 2025

On Wednesday, the EUR/USD pair rebounded from the 127.2% Fibonacci retracement level at 1.1712, reversed in favor of the euro, and continued to rise toward the 1.1802 level. A rebound

Samir Klishi 11:21 2025-07-24 UTC+2

Forecast for GBP/USD on July 24, 2025

On the hourly chart, the GBP/USD pair consolidated above the 61.8% Fibonacci retracement level at 1.3530 on Wednesday and rose to the 50.0% level at 1.3579. Today, a rebound from

Samir Klishi 11:05 2025-07-24 UTC+2

Trading Signals for BITCOIN for July 24-27, 2025: buy above $117,000 (6/8 Murray - 21 SMA)

The eagle indicator has been showing a positive signal since July 21. It is likely that any pullback in Bitcoin in the coming days will be seen as a signal

Dimitrios Zappas 06:25 2025-07-24 UTC+2

Trading Signals for GOLD (XAU/USD) for July 24-27, 2025: sell below $3,400 (21 SMA - 7/8 Murray)

The Eagle indicator is signaling a negative sequence, so we believe that any technical rebound, as long as the price trades below the 8/8 Murray level, will be seen

Dimitrios Zappas 06:23 2025-07-24 UTC+2

Trading Signals for EUR/USD for July 24-27, 2025: buy above 1.1745 (21 SMA - 8/8 Murray)

Technically, the euro is reaching exhaustion levels. In the latest trading, Japanese candlesticks called dojis can be seen on the technical chart, indicating market indecision. A technical correction is likely

Dimitrios Zappas 06:18 2025-07-24 UTC+2

If the support level 6327.24 on S&P 500 Index's can withstand today's downward correction, it will lead to renewed strengthening.Thursday, July 24, 2025.

S&P 500 Index – Thursday, July 24, 2025. With the Golden Cross EMA(50) above the EMA(200), buyers are quite dominant. Although the RSI(14) indicator is at a neutral bullish level

Arief Makmur 05:54 2025-07-24 UTC+2

Although buyers still dominate the Nasdaq 100 Index, but there is potential for a downward correction today, Thursday, July 24, 2025.

Nasdaq 100 Index – Thursday, July 24, 2025. By the appearance of divergence between the Nasdaq 100 Index price movement and the RSI(14) indicator indicates that #NDX has the potential

Arief Makmur 05:53 2025-07-24 UTC+2

EUR/USD Forecast for July 24, 2025

Amid ongoing optimism in equity markets driven by the U.S.–Japan trade deal, the dollar index fell by 0.18% yesterday, while the euro rose by 0.16% (16 pips). The price

Laurie Bailey 05:18 2025-07-24 UTC+2

GBP/USD Forecast for July 24, 2025

Amid overall market optimism (S&P 500 +0.78%), the British pound gained 48 pips yesterday. This was enough for the Marlin oscillator on the daily scale to move into positive territory

Laurie Bailey 05:18 2025-07-24 UTC+2
Can't speak right now?
Ask your question in the chat.
Widget callback
 

Dear visitor,

Your IP address shows that you are currently located in the USA. If you are a resident of the United States, you are prohibited from using the services of InstaFintech Group including online trading, online transfers, deposit/withdrawal of funds, etc.

If you think you are seeing this message by mistake and your location is not the US, kindly proceed to the website. Otherwise, you must leave the website in order to comply with government restrictions.

Why does your IP address show your location as the USA?

  • - you are using a VPN provided by a hosting company based in the United States;
  • - your IP does not have proper WHOIS records;
  • - an error occurred in the WHOIS geolocation database.

Please confirm whether you are a US resident or not by clicking the relevant button below. If you choose the wrong option, being a US resident, you will not be able to open an account with InstaForex anyway.

We are sorry for any inconvenience caused by this message.