empty
12.11.2021 11:16 AM
EUR/USD, USD/JPY, GBP/JPY, GOLD simplified wave analysis and forecast on November 12

EUR/USD

Analysis:

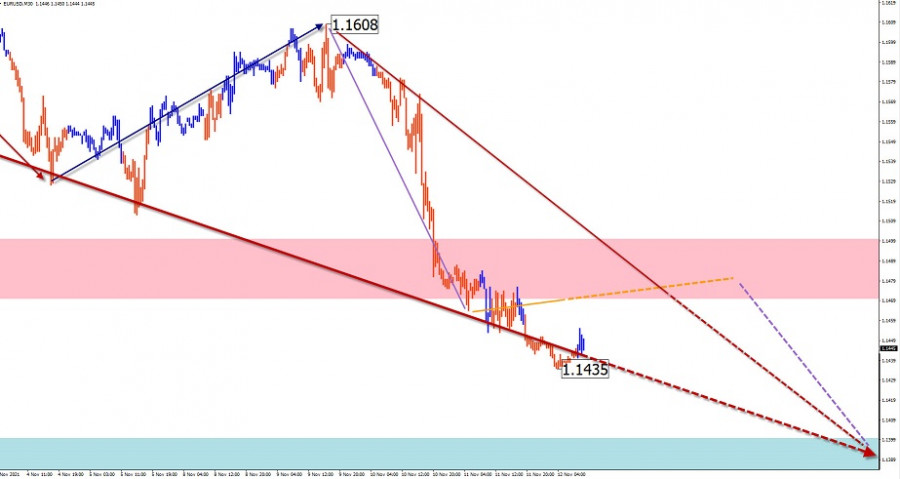
The main direction of the intraday movement of the euro continues to be set by the descending wave from January 6. All counter-movements are within intermediate-term corrections. After breaking through another support, a new section on the main course has started.

Forecast:

A generally flat trading pattern is likely in the coming trading sessions. Short-term price rises are also possible, not beyond the resistance zone. A return to a downtrend is expected at the end of the day or tomorrow.

Potential reversal zones

Resistance:

- 1.1470/1.1500

Support:

- 1.1400/1.1370

Recommendations:

There are no conditions for buying on the euro market today. It is advisable to refrain from entering the market until the completion of the price pullback, with the search for signals to sell the instruments around the calculated resistance.

This image is no longer relevant

USD/JPY

Analysis:

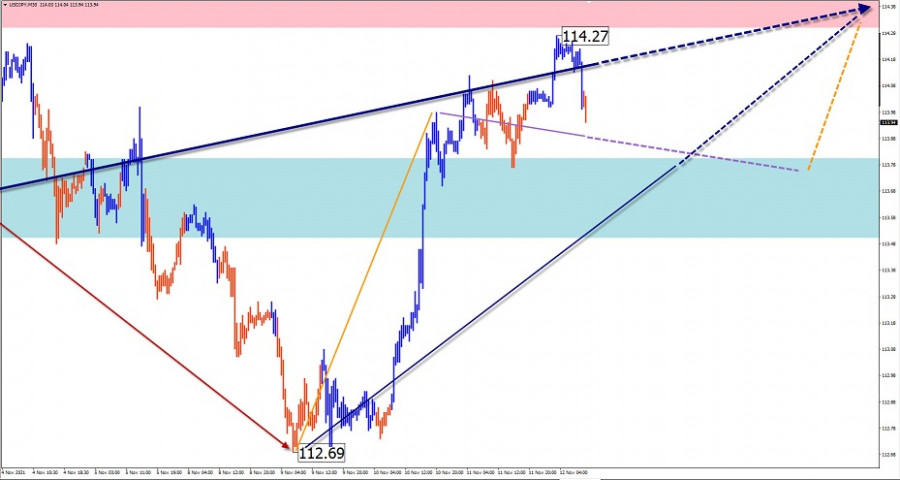
A month-and-a-half-long bearish correction has ended on the Japanese yen major chart. The last leg of the uptrend started on November 9. The price is approaching the lower edge of the wide resistance zone of the upper TF.

Forecast:

In the coming day, the price is expected to move in a narrow range between the opposing zones. After an attempted pressure on the support zone, a change of vector and an upward price move is expected.

Potential reversal zones

Resistance:

- 114.30/114.60

Support:

- 113.80/113.50

Recommendations:

Trading in the Japanese yen market today can be risky. Short-term trades in fractional lots inside the price channel are possible.

This image is no longer relevant

GBP/JPY

Analysis:

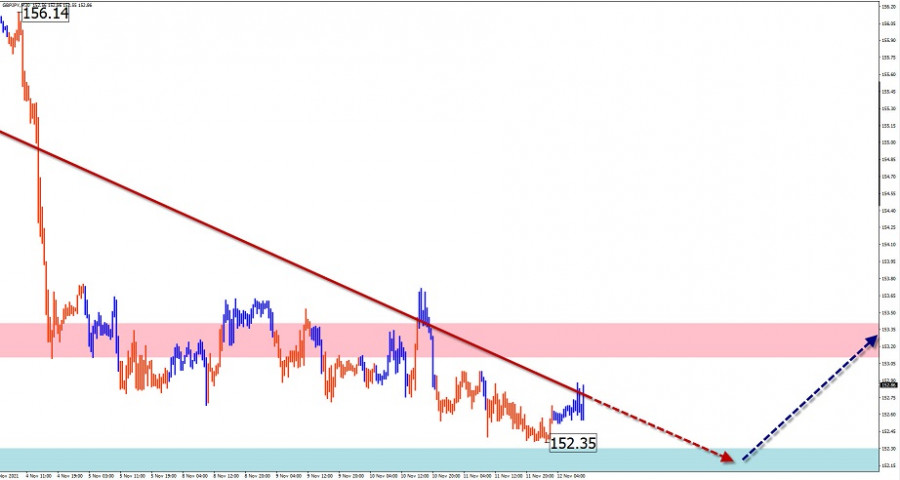
The pound/yen cross continues to move north on the price chart. The price has been forming an intermediate correction from the lower boundary of the strong resistance since October 20. By now the pair has reached a support level.

Forecast:

The general sideways price movement is expected to continue over the next 24 hours. In the second half of the day, after likely pressure on the support zone, a return to an upward vector can be expected, with prices rising towards the resistance zone.

Potential reversal zones

Resistance:

- 153.10/153.40

Support:

- 152.30/152.00

Recommendations:

Trading in this cross pair in the next 24 hours will only be possible in intraday trading with a reduced lot. Buying is more promising today.

This image is no longer relevant

GOLD

Analysis:

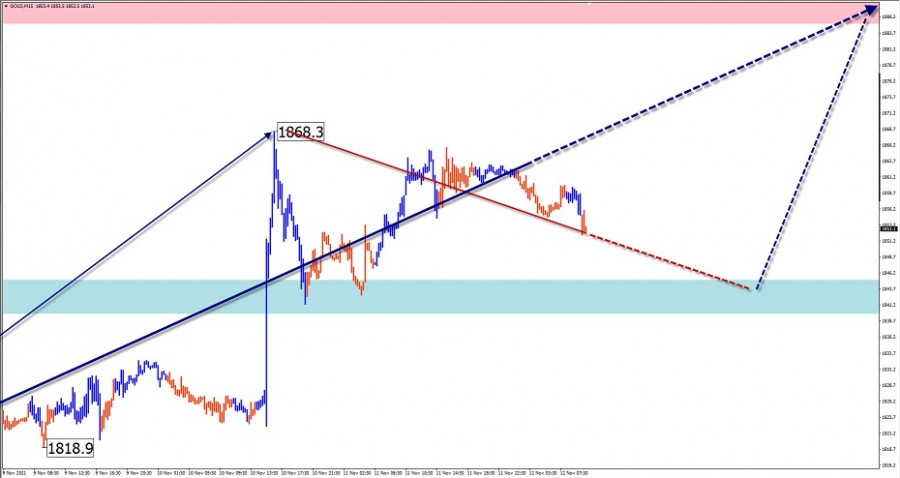
On the gold market, an upward wave has been forming since the end of February. The incomplete portion of the wave dates back to September 30. The gold price is approaching the lower boundary of the potential reversal zone of the senior TF.

Forecast:

Today, the general upward movement is expected to continue. Short-term declines are possible in the European session, but not beyond the support zone. The highest activity is likely by the end of the day.

Potential reversal zones

Resistance:

- 1885.0/1890.0

Support:

- 1845.0/1840.0

Recommendations:

There are no conditions for selling on the gold market today. It is recommended to refrain from entering the instrument until there are clear buying signals around settlement support.

This image is no longer relevant

Explanation: In simplified wave analysis (SVA), waves consist of 3 parts (A-B-C). The last unfinished wave is analysed. The solid arrow background shows the structure formed. The dotted arrow shows the expected movements.

Attention: The wave algorithm does not take into account the duration of the instrument movements over time!

Isabel Clark,
Analytical expert of InstaForex
© 2007-2025
Summary
Urgency
Analytic
Vyacheslav Ognev
Start trade
通过InstaForex赚取加密货币汇率变动的收益。
下载MetaTrader 4并开启您的第一笔交易。
  • Grand Choice
    Contest by
    InstaForex
    InstaForex always strives to help you
    fulfill your biggest dreams.
    JOIN CONTEST

推荐文章

基於簡化波浪分析之每週預測:歐元/美元、美元/日元、英鎊/日元、美元/加元、新西蘭元/美元、黃金及比特幣——8月18日

歐元/美元 分析:自今年二月以來,主要歐元貨幣對的未完成上升波一直在進行中。在最新的階段中,自七月中旬以來,一個複雜形式的反趨勢修正波正在發展中。

Isabel Clark 10:14 2025-08-18 UTC+2

2025年8月15日英鎊/美元分析

英鎊/美元的浪形模式繼續顯示出向上的衝動結構的形成。其波浪形態幾乎與歐元/美元相同,因為美國美元仍然是唯一的「形勢驅動者」。

Chin Zhao 20:06 2025-08-15 UTC+2

2025年8月15日歐元/美元分析

在EUR/USD的4小時圖中,波浪形態已連續數月保持不變,這是一個正面的跡象。即使在形成矯正波時,整體結構仍然保持完好,使得預測能夠精準。

Chin Zhao 19:58 2025-08-15 UTC+2

2025年8月14日英鎊/美元分析

GBP/USD的波浪形態繼續顯示出看漲的衝擊波結構的形成。其波浪圖與EUR/USD幾乎相同,因主要推動力仍然是美元。

Chin Zhao 20:01 2025-08-14 UTC+2

2025年8月14日 歐元/美元分析

在4小時的歐元/美元圖表上,波浪模式幾個月來保持不變,這令人感到鼓舞。即使在修正波形成期間,結構的完整性也得以保留,從而可以進行準確的預測。

Chin Zhao 19:57 2025-08-14 UTC+2

2025年8月13日歐元/美元分析

歐元/美元的4小時波浪形態已經維持數月不變,這一點令人鼓舞。即使在形成修正波時,結構的完整性也得到了保持,從而可以做出精確的預測。

Chin Zhao 20:19 2025-08-13 UTC+2

2025年8月13日英鎊/美元分析

對於英鎊/美元的浪型分析,形態繼續顯示多頭衝撞波浪結構的形成。其波浪配置與歐元/美元幾乎相同,因為唯一實質的驅動因素仍然是美元。

Chin Zhao 20:01 2025-08-13 UTC+2

2025年8月12日,歐元/美元分析

EUR/USD在4小時圖上的波浪結構已經持續數月未變,這令人非常振奮。即使出現調整波浪,結構的完整性仍被保持,這使得預測準確得以實現。

Chin Zhao 20:40 2025-08-12 UTC+2

2025年8月12日英鎊/美元分析

對於GBP/USD,波浪結構仍然顯示出看漲衝動波浪形態的形成。波浪圖幾乎與EUR/USD相同,因為唯一的「罪魁禍首」仍然是美元。

Chin Zhao 20:18 2025-08-12 UTC+2

2025年8月11日英鎊兌美元分析

英鎊/美元的波浪形態繼續顯示上升動力波結構的形成。這種波浪圖幾乎與歐元/美元相同,因為唯一的「驅動因素」仍然是美元。

Chin Zhao 20:43 2025-08-11 UTC+2
现在无法通话?
提出您的问题,用 在线帮助.
Widget callback