signal strength 1 of 5
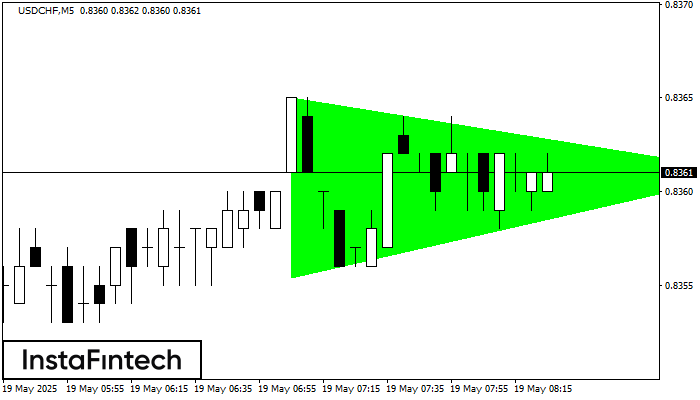
According to the chart of M5, USDCHF formed the Bullish Symmetrical Triangle pattern, which signals the trend will continue. Description. The upper border of the pattern touches the coordinates 0.8365/0.8361 whereas the lower border goes across 0.8355/0.8361. The pattern width is measured on the chart at 10 pips. If the Bullish Symmetrical Triangle pattern is in progress during the upward trend, this indicates the current trend will go on. In case 0.8361 is broken, the price could continue its move toward 0.8376.
The M5 and M15 time frames may have more false entry points.
See Also
- All
- Double Top
- Flag
- Head and Shoulders
- Pennant
- Rectangle
- Triangle
- Triple top
- All
- #AAPL
- #AMZN
- #Bitcoin
- #EBAY
- #FB
- #GOOG
- #INTC
- #KO
- #MA
- #MCD
- #MSFT
- #NTDOY
- #PEP
- #TSLA
- #TWTR
- AUDCAD
- AUDCHF
- AUDJPY
- AUDUSD
- EURCAD
- EURCHF
- EURGBP
- EURJPY
- EURNZD
- EURRUB
- EURUSD
- GBPAUD
- GBPCHF
- GBPJPY
- GBPUSD
- GOLD
- NZDCAD
- NZDCHF
- NZDJPY
- NZDUSD
- SILVER
- USDCAD
- USDCHF
- USDJPY
- USDRUB
- All
- M5
- M15
- M30
- H1
- D1
- All
- Buy
- Sale
- All
- 1
- 2
- 3
- 4
- 5
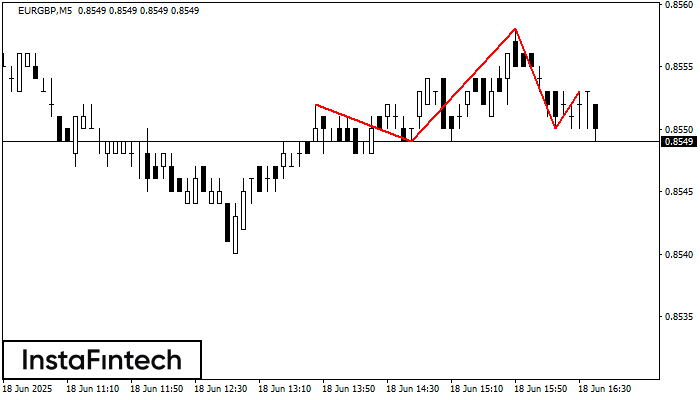
The technical pattern called Head and Shoulders has appeared on the chart of EURGBP M5. There are weighty reasons to suggest that the price will surpass the Neckline 0.8549/0.8550 after
The M5 and M15 time frames may have more false entry points.
Open chart in a new window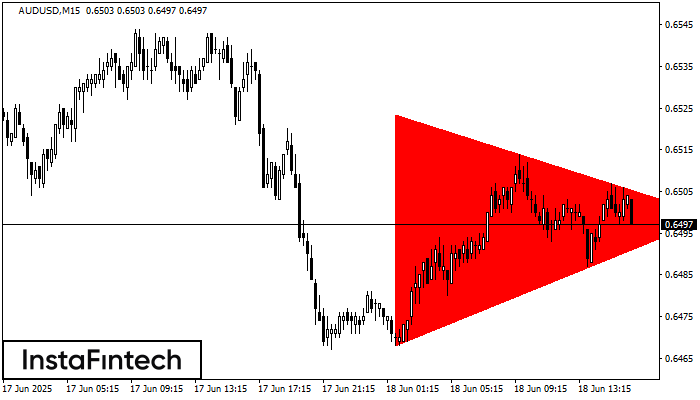
According to the chart of M15, AUDUSD formed the Bearish Symmetrical Triangle pattern. Description: The lower border is 0.6468/0.6499 and upper border is 0.6523/0.6499. The pattern width is measured
The M5 and M15 time frames may have more false entry points.
Open chart in a new window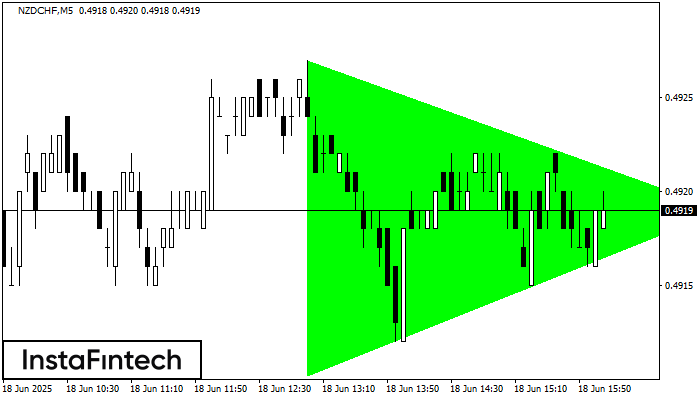
According to the chart of M5, NZDCHF formed the Bullish Symmetrical Triangle pattern. Description: This is the pattern of a trend continuation. 0.4927 and 0.4910 are the coordinates
The M5 and M15 time frames may have more false entry points.
Open chart in a new window