signal strength 1 of 5
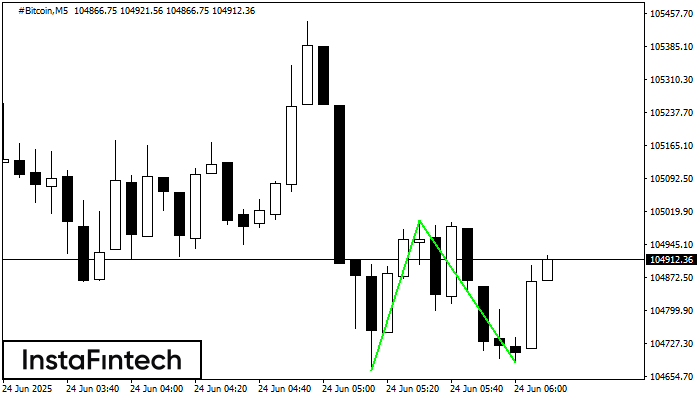
The Double Bottom pattern has been formed on #Bitcoin M5. This formation signals a reversal of the trend from downwards to upwards. The signal is that a buy trade should be opened after the upper boundary of the pattern 105000.05 is broken. The further movements will rely on the width of the current pattern 33255 points.
The M5 and M15 time frames may have more false entry points.
- All
- Double Top
- Flag
- Head and Shoulders
- Pennant
- Rectangle
- Triangle
- Triple top
- All
- #AAPL
- #AMZN
- #Bitcoin
- #EBAY
- #FB
- #GOOG
- #INTC
- #KO
- #MA
- #MCD
- #MSFT
- #NTDOY
- #PEP
- #TSLA
- #TWTR
- AUDCAD
- AUDCHF
- AUDJPY
- AUDUSD
- EURCAD
- EURCHF
- EURGBP
- EURJPY
- EURNZD
- EURRUB
- EURUSD
- GBPAUD
- GBPCHF
- GBPJPY
- GBPUSD
- GOLD
- NZDCAD
- NZDCHF
- NZDJPY
- NZDUSD
- SILVER
- USDCAD
- USDCHF
- USDJPY
- USDRUB
- All
- M5
- M15
- M30
- H1
- D1
- All
- Buy
- Sale
- All
- 1
- 2
- 3
- 4
- 5
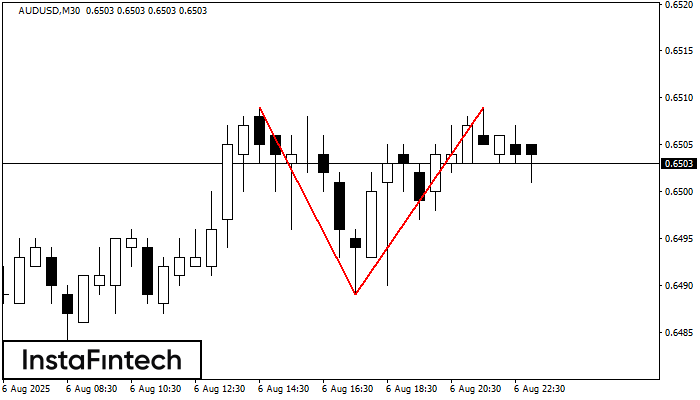
The Double Top pattern has been formed on AUDUSD M30. It signals that the trend has been changed from upwards to downwards. Probably, if the base of the pattern 0.6489
Open chart in a new window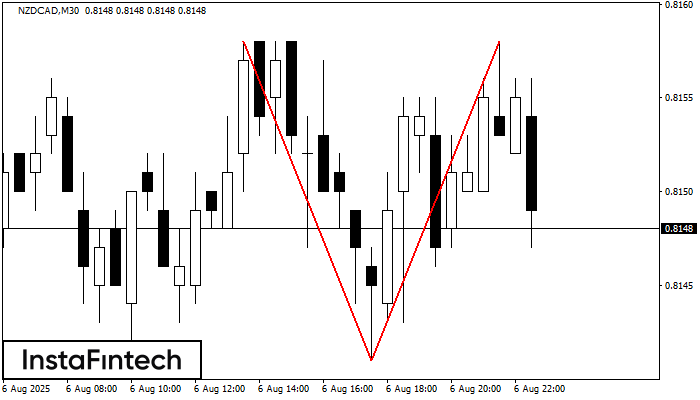
The Double Top pattern has been formed on NZDCAD M30. It signals that the trend has been changed from upwards to downwards. Probably, if the base of the pattern 0.8141
Open chart in a new window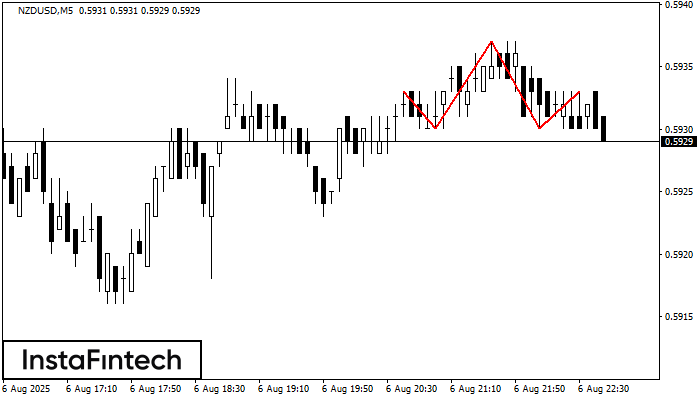
The NZDUSD M5 formed the Head and Shoulders pattern with the following features: The Head’s top is at 0.5937, the Neckline and the upward angle are at 0.5930/0.5930. The formation
The M5 and M15 time frames may have more false entry points.
Open chart in a new window