signal strength 2 of 5
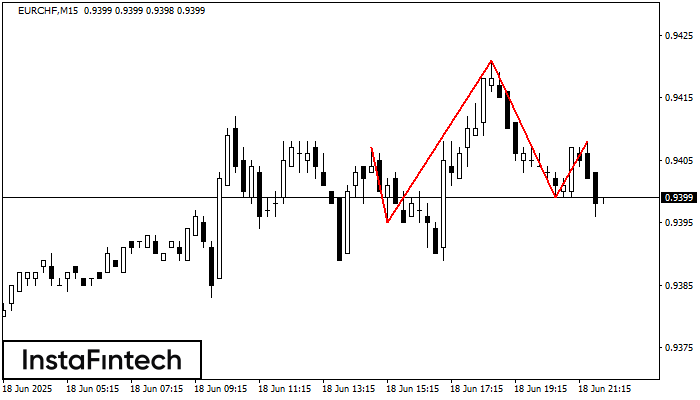
The technical pattern called Head and Shoulders has appeared on the chart of EURCHF M15. There are weighty reasons to suggest that the price will surpass the Neckline 0.9395/0.9399 after the right shoulder has been formed. So, the trend is set to change with the price heading for 0.9377.
The M5 and M15 time frames may have more false entry points.
- All
- Double Top
- Flag
- Head and Shoulders
- Pennant
- Rectangle
- Triangle
- Triple top
- All
- #AAPL
- #AMZN
- #Bitcoin
- #EBAY
- #FB
- #GOOG
- #INTC
- #KO
- #MA
- #MCD
- #MSFT
- #NTDOY
- #PEP
- #TSLA
- #TWTR
- AUDCAD
- AUDCHF
- AUDJPY
- AUDUSD
- EURCAD
- EURCHF
- EURGBP
- EURJPY
- EURNZD
- EURRUB
- EURUSD
- GBPAUD
- GBPCHF
- GBPJPY
- GBPUSD
- GOLD
- NZDCAD
- NZDCHF
- NZDJPY
- NZDUSD
- SILVER
- USDCAD
- USDCHF
- USDJPY
- USDRUB
- All
- M5
- M15
- M30
- H1
- D1
- All
- Buy
- Sale
- All
- 1
- 2
- 3
- 4
- 5
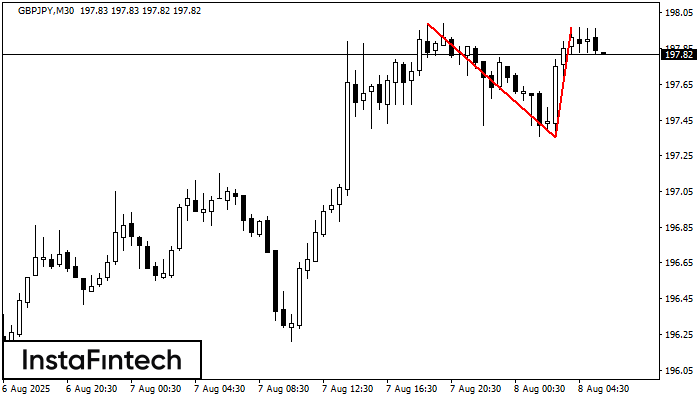
The Double Top pattern has been formed on GBPJPY M30. It signals that the trend has been changed from upwards to downwards. Probably, if the base of the pattern 197.35
Open chart in a new window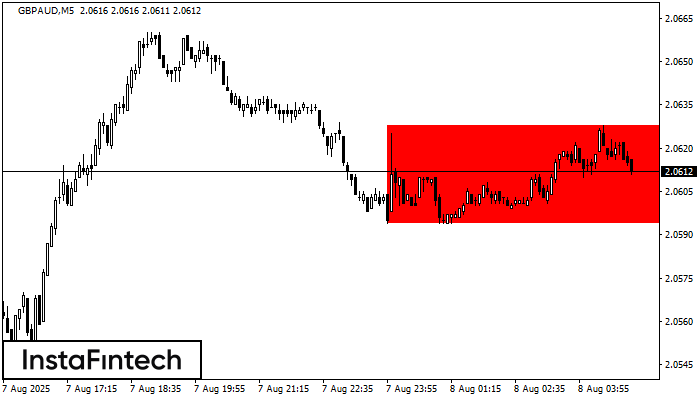
According to the chart of M5, GBPAUD formed the Bearish Rectangle. The pattern indicates a trend continuation. The upper border is 2.0628, the lower border is 2.0594. The signal means
The M5 and M15 time frames may have more false entry points.
Open chart in a new window
The NZDUSD M5 formed the Head and Shoulders pattern with the following features: The Head’s top is at 0.5969, the Neckline and the upward angle are at 0.5955/0.5956. The formation
The M5 and M15 time frames may have more false entry points.
Open chart in a new window