signal strength 1 of 5
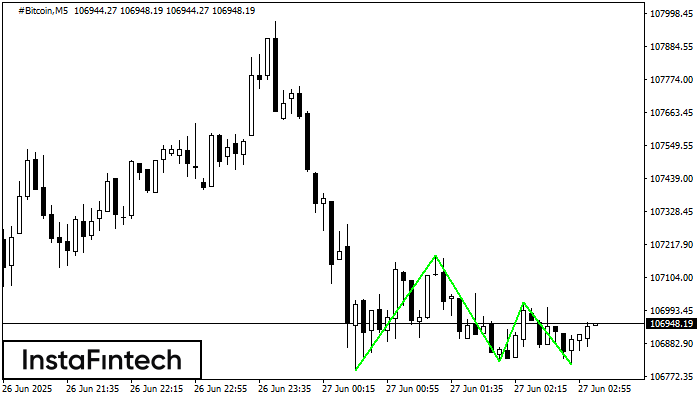
The Triple Bottom pattern has been formed on #Bitcoin M5. It has the following characteristics: resistance level 107179.04/107022.10; support level 106791.83/106811.21; the width is 38721 points. In the event of a breakdown of the resistance level of 107179.04, the price is likely to continue an upward movement at least to 106822.70.
The M5 and M15 time frames may have more false entry points.
See Also
- All
- Double Top
- Flag
- Head and Shoulders
- Pennant
- Rectangle
- Triangle
- Triple top
- All
- #AAPL
- #AMZN
- #Bitcoin
- #EBAY
- #FB
- #GOOG
- #INTC
- #KO
- #MA
- #MCD
- #MSFT
- #NTDOY
- #PEP
- #TSLA
- #TWTR
- AUDCAD
- AUDCHF
- AUDJPY
- AUDUSD
- EURCAD
- EURCHF
- EURGBP
- EURJPY
- EURNZD
- EURRUB
- EURUSD
- GBPAUD
- GBPCHF
- GBPJPY
- GBPUSD
- GOLD
- NZDCAD
- NZDCHF
- NZDJPY
- NZDUSD
- SILVER
- USDCAD
- USDCHF
- USDJPY
- USDRUB
- All
- M5
- M15
- M30
- H1
- D1
- All
- Buy
- Sale
- All
- 1
- 2
- 3
- 4
- 5
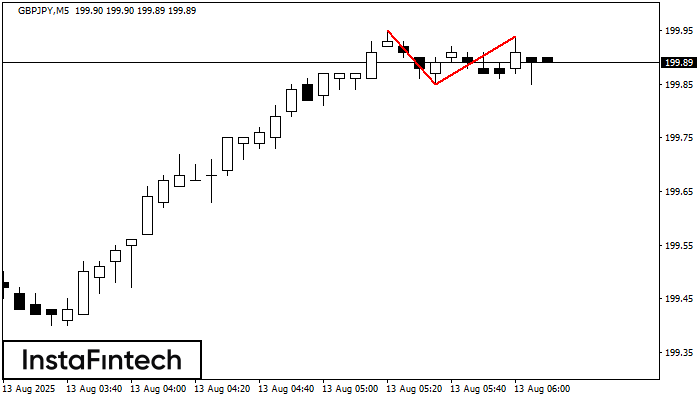
On the chart of GBPJPY M5 the Double Top reversal pattern has been formed. Characteristics: the upper boundary 199.94; the lower boundary 199.85; the width of the pattern 9 points
The M5 and M15 time frames may have more false entry points.
Open chart in a new window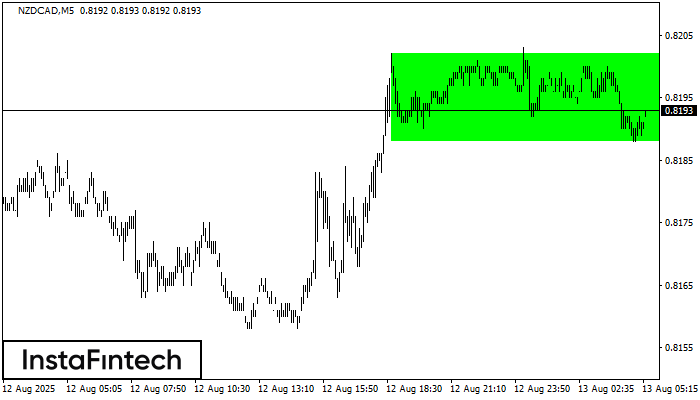
According to the chart of M5, NZDCAD formed the Bullish Rectangle which is a pattern of a trend continuation. The pattern is contained within the following borders: the lower border
The M5 and M15 time frames may have more false entry points.
Open chart in a new window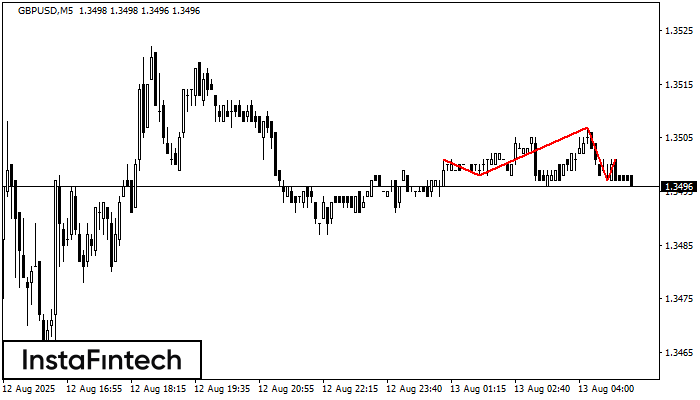
The GBPUSD M5 formed the Head and Shoulders pattern with the following features: The Head’s top is at 1.3507, the Neckline and the upward angle are at 1.3498/1.3497. The formation
The M5 and M15 time frames may have more false entry points.
Open chart in a new window