signal strength 1 of 5
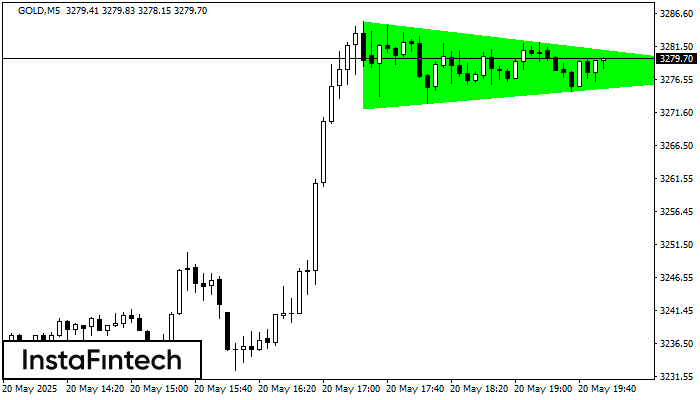
According to the chart of M5, GOLD formed the Bullish Symmetrical Triangle pattern. Description: This is the pattern of a trend continuation. 3285.27 and 3272.11 are the coordinates of the upper and lower borders respectively. The pattern width is measured on the chart at 1316 pips. Outlook: If the upper border 3285.27 is broken, the price is likely to continue its move by 3277.69.
The M5 and M15 time frames may have more false entry points.
- All
- Double Top
- Flag
- Head and Shoulders
- Pennant
- Rectangle
- Triangle
- Triple top
- All
- #AAPL
- #AMZN
- #Bitcoin
- #EBAY
- #FB
- #GOOG
- #INTC
- #KO
- #MA
- #MCD
- #MSFT
- #NTDOY
- #PEP
- #TSLA
- #TWTR
- AUDCAD
- AUDCHF
- AUDJPY
- AUDUSD
- EURCAD
- EURCHF
- EURGBP
- EURJPY
- EURNZD
- EURRUB
- EURUSD
- GBPAUD
- GBPCHF
- GBPJPY
- GBPUSD
- GOLD
- NZDCAD
- NZDCHF
- NZDJPY
- NZDUSD
- SILVER
- USDCAD
- USDCHF
- USDJPY
- USDRUB
- All
- M5
- M15
- M30
- H1
- D1
- All
- Buy
- Sale
- All
- 1
- 2
- 3
- 4
- 5
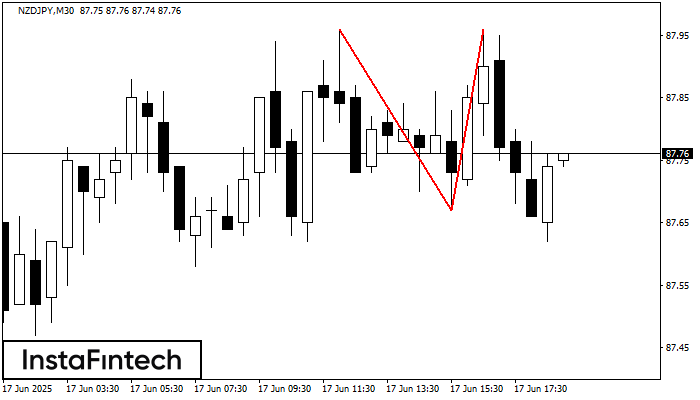
On the chart of NZDJPY M30 the Double Top reversal pattern has been formed. Characteristics: the upper boundary 87.96; the lower boundary 87.67; the width of the pattern 29 points
Open chart in a new window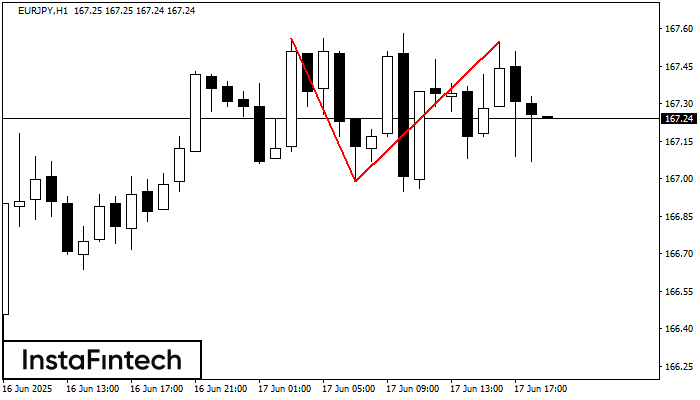
The Double Top pattern has been formed on EURJPY H1. It signals that the trend has been changed from upwards to downwards. Probably, if the base of the pattern 166.99
Open chart in a new window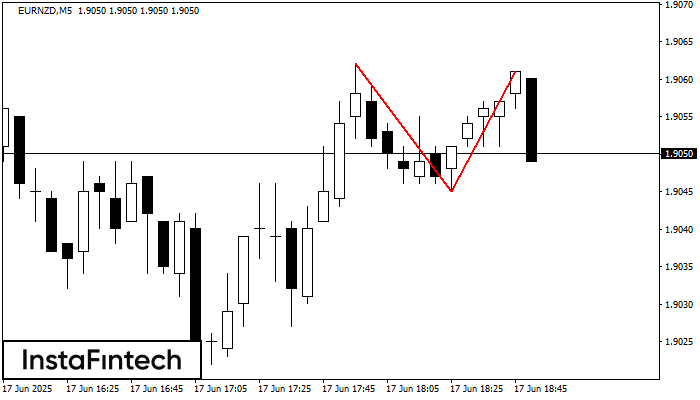
The Double Top pattern has been formed on EURNZD M5. It signals that the trend has been changed from upwards to downwards. Probably, if the base of the pattern 1.9045
The M5 and M15 time frames may have more false entry points.
Open chart in a new window