empty
24.06.2024 05:00 AM
Forecast for USD/JPY on June 24, 2024

USD/JPY

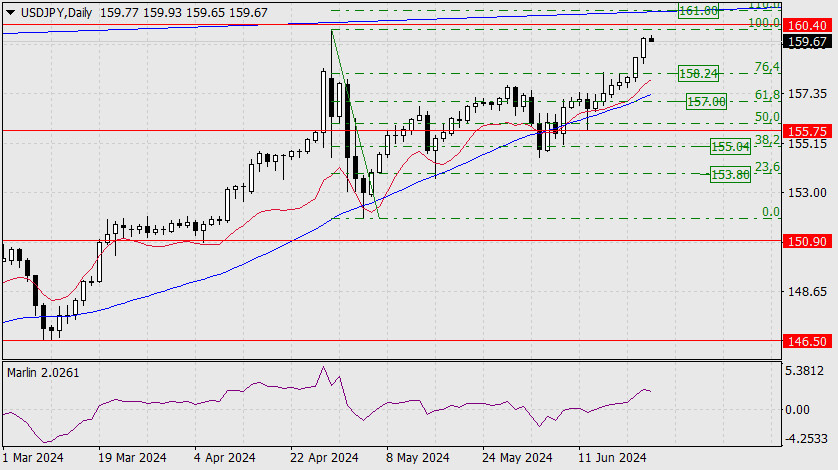
The dollar repeated its pattern of impulsive growth from Thursday, as it jumped by 86 pips on Friday. The target level of 160.40 is already close, and it exceeds the high on April 29th. Next, the target mark of 161.00 is visible - the point where the upper boundary of the price channel coincides with the Fibonacci level of 110.0%.

This image is no longer relevant

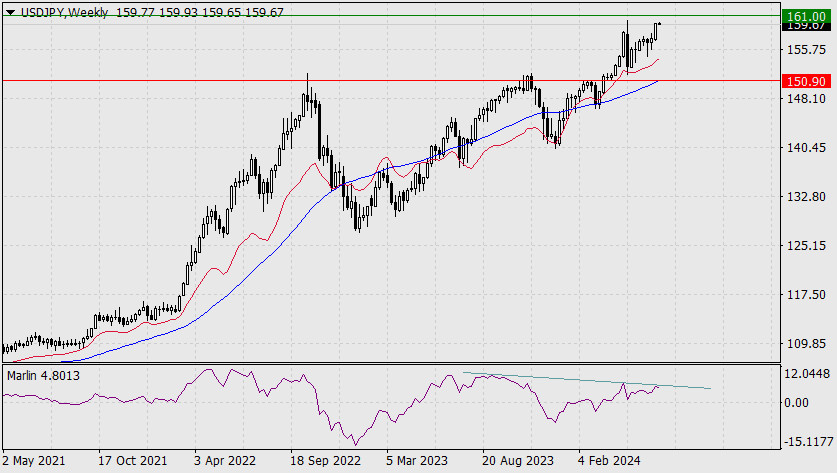
We are expecting a price reversal from one of these target levels. A triple divergence with the Marlin oscillator will form amid such a reversal on the weekly scale.

This image is no longer relevant

The Marlin oscillator shows the beginning of a reversal, which is already a sign that the price may not even reach the level of 160.40. In this scenario, we can confirm the reversal when the price moves below the Fibonacci level of 76.4% (158.24). If the price reaches 161.00, a decline may occur if it moves below 160.40.

This image is no longer relevant

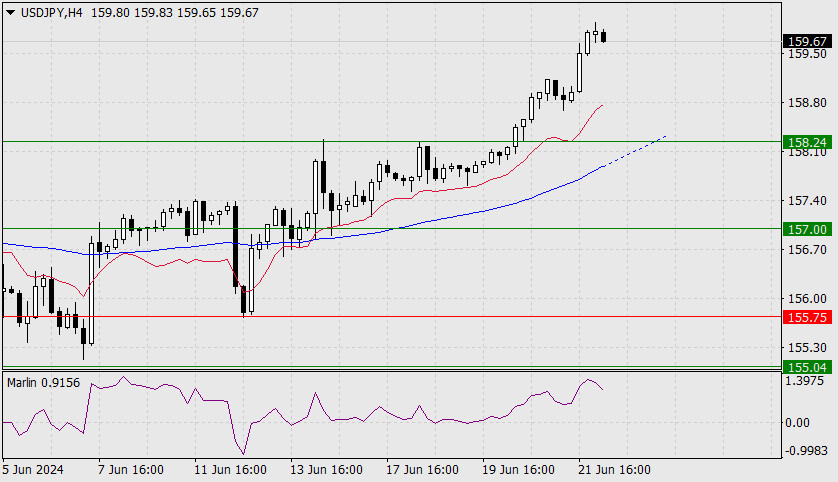
The price and the oscillator are turning downwards on the 4-hour chart. The signal is weak but may grow stronger over time. The MACD line is approaching the level of 158.24, reinforcing the support. If the price surpasses this mark, this could fuel the decline. Take note that on the daily chart, the MACD line is approaching the level of 158.24. We await further clarity in the situation.

Laurie Bailey,
Analytical expert of InstaForex
© 2007-2025
Summary
Urgency
Analytic
Yuriy Zaycev
Start trade
Earn on cryptocurrency rate changes with InstaForex
Download MetaTrader 4 and open your first trade
  • Grand Choice
    Contest by
    InstaForex
    InstaForex always strives to help you
    fulfill your biggest dreams.
    JOIN CONTEST

Recommended Stories

USD/JPY. Analysis and Forecast

Today, the USD/JPY pair has shown some resilience below the 100-hour Simple Moving Average (SMA) From a technical perspective, the USD/JPY pair demonstrated some stability today below the 100-hour

Irina Yanina 19:25 2025-07-17 UTC+2

GBP/USD. Indicator Analysis on July 17th

On Wednesday, the pair moved upward (on news), reaching the 8-period EMA at 1.3489 (thin blue line), then declined and closed the daily candle at 1.3417. Today, it may continue

Stefan Doll 12:12 2025-07-17 UTC+2

Forex forecast 17/07/2025: EUR/USD, GBP/USD, USD/JPY, SP500 and Bitcoin

Useful links: My other articles are available in this section InstaForex course for beginners Popular Analytics Open trading account Important: The begginers in forex trading need to be very careful

Sebastian Seliga 12:08 2025-07-17 UTC+2

EUR/USD. Indicator Analysis on July 17th

On Wednesday, the pair moved upward (on news), reaching the 23.6% level at 1.1739 (yellow dashed line), and then declined, closing the daily candle at 1.1639. Today, it may continue

Stefan Doll 11:45 2025-07-17 UTC+2

EUR/USD. July 17th. Trump Wants to Fire Powell Again

On Wednesday, the EUR/USD pair reached the 100.0% corrective level at 1.1574, rebounded from it, and rose to the 127.2% Fibonacci level at 1.1712, from which it also bounced

Samir Klishi 11:23 2025-07-17 UTC+2

GBP/USD. July 17th. Unemployment in the UK Continues to Rise

On the hourly chart, the GBP/USD pair rebounded on Wednesday from the support zone of 1.3357–1.3371 and rose to the 76.4% corrective level at 1.3470. A rebound from 1.3470

Samir Klishi 11:15 2025-07-17 UTC+2

AUD/USD. The US Dollar Is Increasing Its Pressure

The strong likelihood that the Federal Reserve will not be able to resume cutting interest rates this year is providing significant support for the U.S. dollar. The dollar index

Pati Gani 10:13 2025-07-17 UTC+2

The DXY has the potential to test its pivot level, but there is potential for further strengthening on Thursday, July 17, 2025.

US Dollar Index – Thursday, July 17, 2025 If the pivot and support levels are able to withstand the #USDX's weakening correction in the near term, the #USDX

Arief Makmur 08:47 2025-07-17 UTC+2

The Nasdaq 100 Index has the potential to weaken and fall to its nearest support level on Thursday, July 17, 2025.

Nasdaq 100 Index - Thursday, July 17, 2025 The #NDX price movement is below the EMA(20) and EMA(50), supported by the RSI(14) at a neutral bearish level. Therefore, the #NDX

Arief Makmur 08:47 2025-07-17 UTC+2

Expectations of a Stock Market Decline Through the Lens of the EUR/JPY Cross Rate

Historically, investor flight from the stock market has inevitably been reflected in a decline of the EUR/JPY pair, as it sums up the exit from risk currencies (such

Laurie Bailey 07:41 2025-07-17 UTC+2
Can't speak right now?
Ask your question in the chat.
Widget callback
 

Dear visitor,

Your IP address shows that you are currently located in the USA. If you are a resident of the United States, you are prohibited from using the services of InstaFintech Group including online trading, online transfers, deposit/withdrawal of funds, etc.

If you think you are seeing this message by mistake and your location is not the US, kindly proceed to the website. Otherwise, you must leave the website in order to comply with government restrictions.

Why does your IP address show your location as the USA?

  • - you are using a VPN provided by a hosting company based in the United States;
  • - your IP does not have proper WHOIS records;
  • - an error occurred in the WHOIS geolocation database.

Please confirm whether you are a US resident or not by clicking the relevant button below. If you choose the wrong option, being a US resident, you will not be able to open an account with InstaForex anyway.

We are sorry for any inconvenience caused by this message.