empty
11.11.2024 12:41 PM
EUR/USD and GBP/USD: technical analysis on 11.11.2024

EUR/USD

This image is no longer relevant

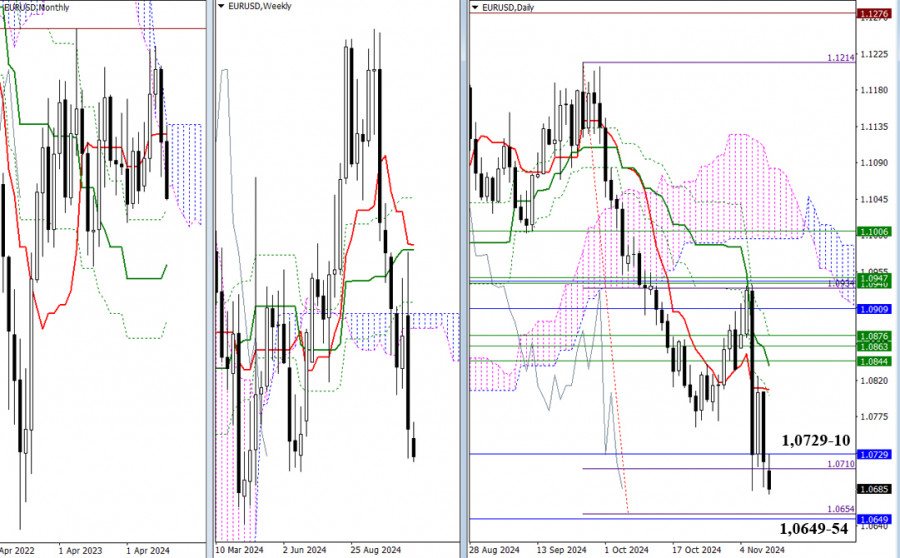
Last week, the EUR/USD pair tested the support of the lower border of the monthly cloud at 1.0729 and the first target point of the daily breakout goal at 1.0710, closing the week near these levels. Today, the currency pair opened with a slight downward gap, signaling that bearish players are expressing their intent to go ahead with the decline. If this trend holds, the next targets are around 1.0649-54 (100% completion of the daily target + weekly Fibonacci Kijun). However, a bearish failure would lead to a recovery of bullish positions. If the price rises, the market will first encounter resistance from the daily dead cross at 1.0809 (Tenkan) – 1.0838 (Kijun).

This image is no longer relevant

H4 – H1

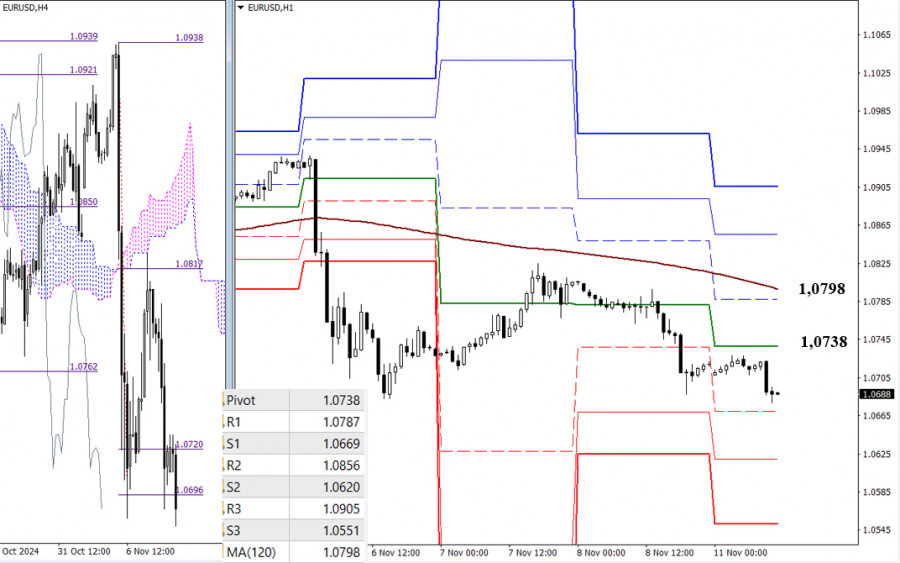
On lower timeframes, bearish players are currently holding the main advantage, allowing them to implement a gradual decline. Intraday levels to reinforce bearish sentiment include supports from the classical Pivot levels at 1.0669, 1.0620, and 1.0551. Key levels today act as resistance and are positioned at 1.0738 (central Pivot of the day) and 1.0798 (weekly long-term trend), which will come into play if a corrective rise occurs. A breakout and trend reversal would shift the balance in favor of cementing bullish sentiment. The next upward targets intraday would be the resistance levels of the classical Pivot points at 1.0856 and 1.0905.

***

GBP/USD

This image is no longer relevant

Higher timeframes

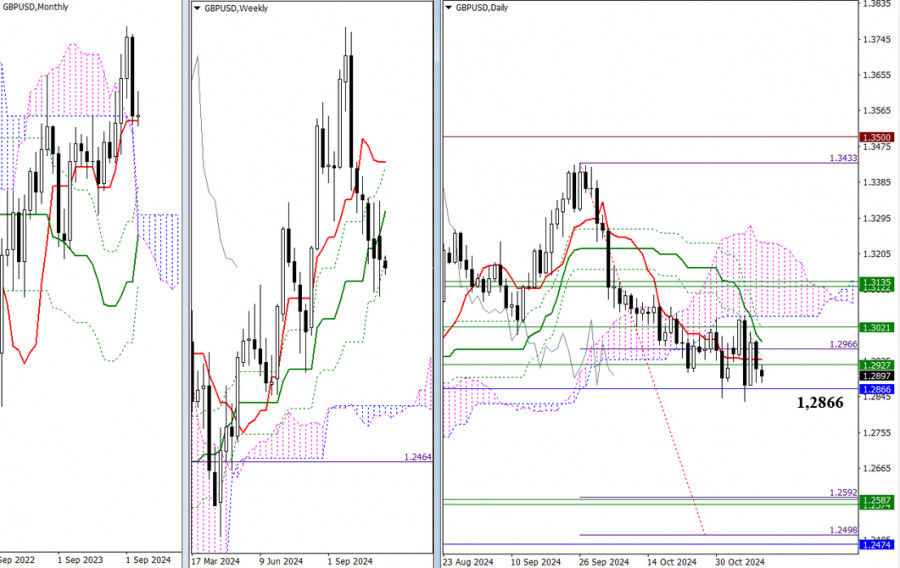
Recently, bearish players have consolidated and are aiming to break through encountered supports, led by the monthly short-term trend at 1.2866, in pursuit of their targets. They now need to neutralize the weekly golden cross, whose final level has risen to 1.2927 today, and secure support from the monthly short-term trend at 1.2866. Once these tasks are completed, new opportunities may open up for bearish players. If they fail, the GBP/USD pair will face significant clusters of current resistances from the daily and weekly Ichimoku crosses at 1.2927, 1.2940, 1.2983, 1.3021, 1.3049, and so on.

This image is no longer relevant

H4 – H1

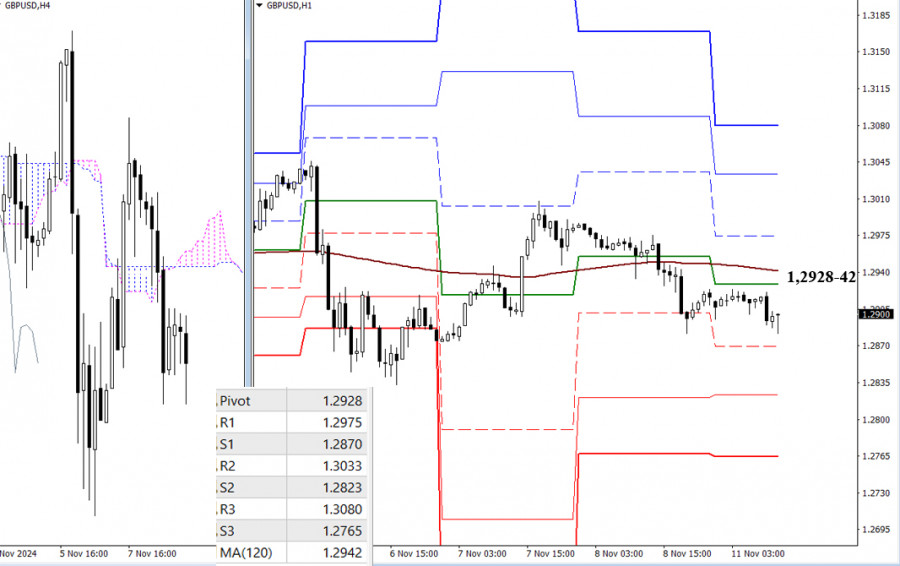
Consolidation on higher timeframes prevents the lower timeframes from operating steadily and in a clear direction. Instead, the GBP/USD pair is hovering around the key levels of 1.2829-42 (central daily Pivot level + weekly long-term trend), creating some uncertainty. Should one side gain momentum, intraday action will engage either the resistance levels at 1.2975, 1.3033, and 1.3080 or the support levels at 1.2870, 1.2823, and 1.2765 of the classical Pivot points.

***

This technical analysis is based on the following ideas:

Larger timeframes - Ichimoku Kinko Hyo (9.26.52) + Fibo Kijun levels

Lower timeframes - H1 – classic pivot points + 120-period Moving Average (weekly long-term trendline)

Evangelos Poulakis,
Analytical expert of InstaForex
© 2007-2025
Select timeframe
5
min
15
min
30
min
1
hour
4
hours
1
day
1
week
Earn on cryptocurrency rate changes with InstaForex
Download MetaTrader 4 and open your first trade
  • Grand Choice
    Contest by
    InstaForex
    InstaForex always strives to help you
    fulfill your biggest dreams.
    JOIN CONTEST

Recommended Stories

Forecast for EUR/USD on July 10, 2025

On Wednesday, the EUR/USD pair continued to move along a trajectory known only to itself. The 127.2% Fibonacci correction level at 1.1712 was once again ignored by traders. I still

Samir Klishi 12:21 2025-07-10 UTC+2

Forecast for GBP/USD on July 10, 2025

On the hourly chart, the GBP/USD pair continued its upward movement on Wednesday after rebounding from the 127.2% Fibonacci corrective level at 1.3527. The rebound was precise, leading

Samir Klishi 10:35 2025-07-10 UTC+2

GBP/JPY. Analysis, Forecast, and Current Market Situation

On Thursday, the GBP/JPY pair is regaining upward momentum and shows readiness for further growth. The formation of an ascending channel confirms the stability of the bullish trend. During

Irina Yanina 10:22 2025-07-10 UTC+2

If the resistance level of 0.7964 holds back its upward movement, USD/CHF has the potential to weaken on Thursday, July 10, 2025.

USD/CHF, Thursday, July 10, 2025 In addition to rumors of a planned Fed interest rate cut and falling US government bond yields, USD/CHF weakened today. Key Levels 1. Resistance

Arief Makmur 06:47 2025-07-10 UTC+2

Cable has the potential to test its Pivot and Support 1 levels in the near future, Thursday, July 10, 2025.

GBP/USD, Thursday, July 10, 2025. Rumors of the Fed's future dovish policy have created negative sentiment towards the USD, potentially helping the pound sterling strengthen again today. Key Levels

Arief Makmur 06:47 2025-07-10 UTC+2

EUR/USD Forecast for July 10, 2025

Markets continue to test risk-on strategies—yesterday, the S&P 500 rose by 0.61%, oil slipped by 0.22%, and the euro declined by just 4 points, which, given the low daily volatility

Laurie Bailey 06:14 2025-07-10 UTC+2

Trading Signals for GOLD (XAU/USD) for July 10-15, 2025: sell below $3,330 (21 SMA - 200 EMA)

If the bullish momentum prevails, we should buy gold above the 200 EMA located at 3,324. The outlook could be positive, with the price reaching 3,450 in the short term

Dimitrios Zappas 06:10 2025-07-10 UTC+2

Trading Signals for EUR/USD for July 10-15, 2025: sell below 1.1753 (200 EMA - +1/8 Murray)

Early in the European session, the euro is trading around 1.1737, above the 21 SMA and attempting to break the top of the downtrend channel formed since late June

Dimitrios Zappas 06:08 2025-07-10 UTC+2

GBP/USD Forecast for July 10, 2025

The British pound is slowly approaching the target resistance at 1.3635. A breakout above this level would open the way to the MACD line at 1.3705. This target is likely

Laurie Bailey 05:53 2025-07-10 UTC+2

AUD/USD Forecast for July 10, 2025

AUD/USDOn the daily chart, the Marlin oscillator continues its prolonged movement along the neutral zero line. As the price breaks through new local resistance or support levels, it encounters

Laurie Bailey 05:42 2025-07-10 UTC+2
Can't speak right now?
Ask your question in the chat.
Widget callback
 

Dear visitor,

Your IP address shows that you are currently located in the USA. If you are a resident of the United States, you are prohibited from using the services of InstaFintech Group including online trading, online transfers, deposit/withdrawal of funds, etc.

If you think you are seeing this message by mistake and your location is not the US, kindly proceed to the website. Otherwise, you must leave the website in order to comply with government restrictions.

Why does your IP address show your location as the USA?

  • - you are using a VPN provided by a hosting company based in the United States;
  • - your IP does not have proper WHOIS records;
  • - an error occurred in the WHOIS geolocation database.

Please confirm whether you are a US resident or not by clicking the relevant button below. If you choose the wrong option, being a US resident, you will not be able to open an account with InstaForex anyway.

We are sorry for any inconvenience caused by this message.