empty
08.05.2025 04:18 AM
Trading Recommendations and Analysis for EUR/USD on May 8: All the Excitement Is Behind Us

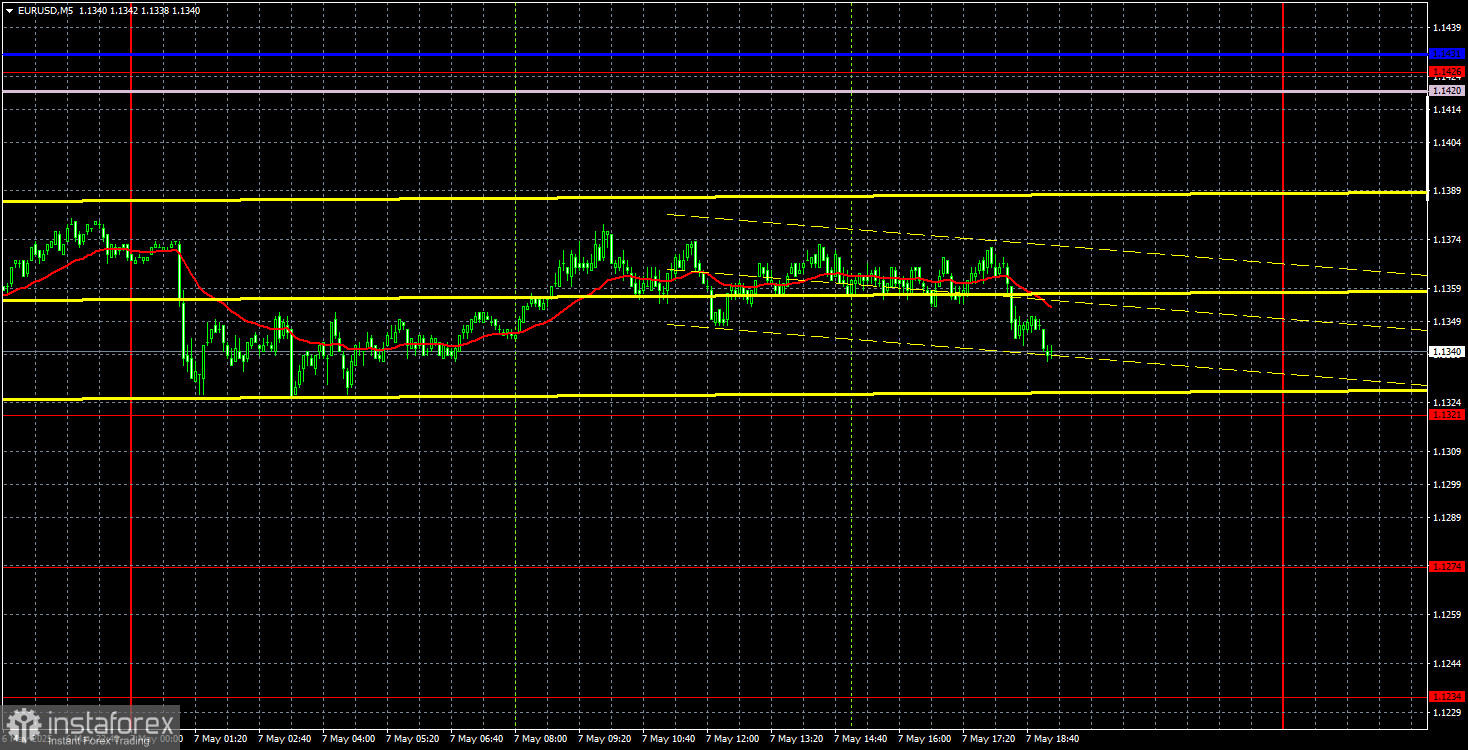
EUR/USD 5-Minute Analysis

This image is no longer relevant

On Wednesday, the EUR/USD currency pair continued to trade in the same flat range. The 1.1274 and 1.1426 levels bound the broader sideways channel, while the narrower channel ranges between 1.1274 and 1.1370. Throughout the day, only one report was published in the Eurozone and the US that had the slightest potential to affect the pair's movement — Eurozone retail sales. The report showed a 0.1% monthly decline in March, which was naturally worse than expected. However, as anticipated, traders paid no attention to this release. The pair spent the entire day trading with minimal volatility.

This article will not analyze the Federal Reserve meeting and its outcomes yet. We believe the market needs time to digest the information. After a Fed meeting, the price often moves sharply in one direction only to reverse course within hours. Therefore, it's best to wait for the market to settle before evaluating the meeting's outcome and the market's response.

On the 5-minute chart, no trading signal was generated on Wednesday. The price didn't approach any levels or Ichimoku indicator lines throughout the day. Given the weak movement and proximity of the Fed meeting, the absence of signals is even a positive. In any case, the pair was situated in the middle of the flat channel, and it's generally better to trade at least from the boundaries in such conditions.
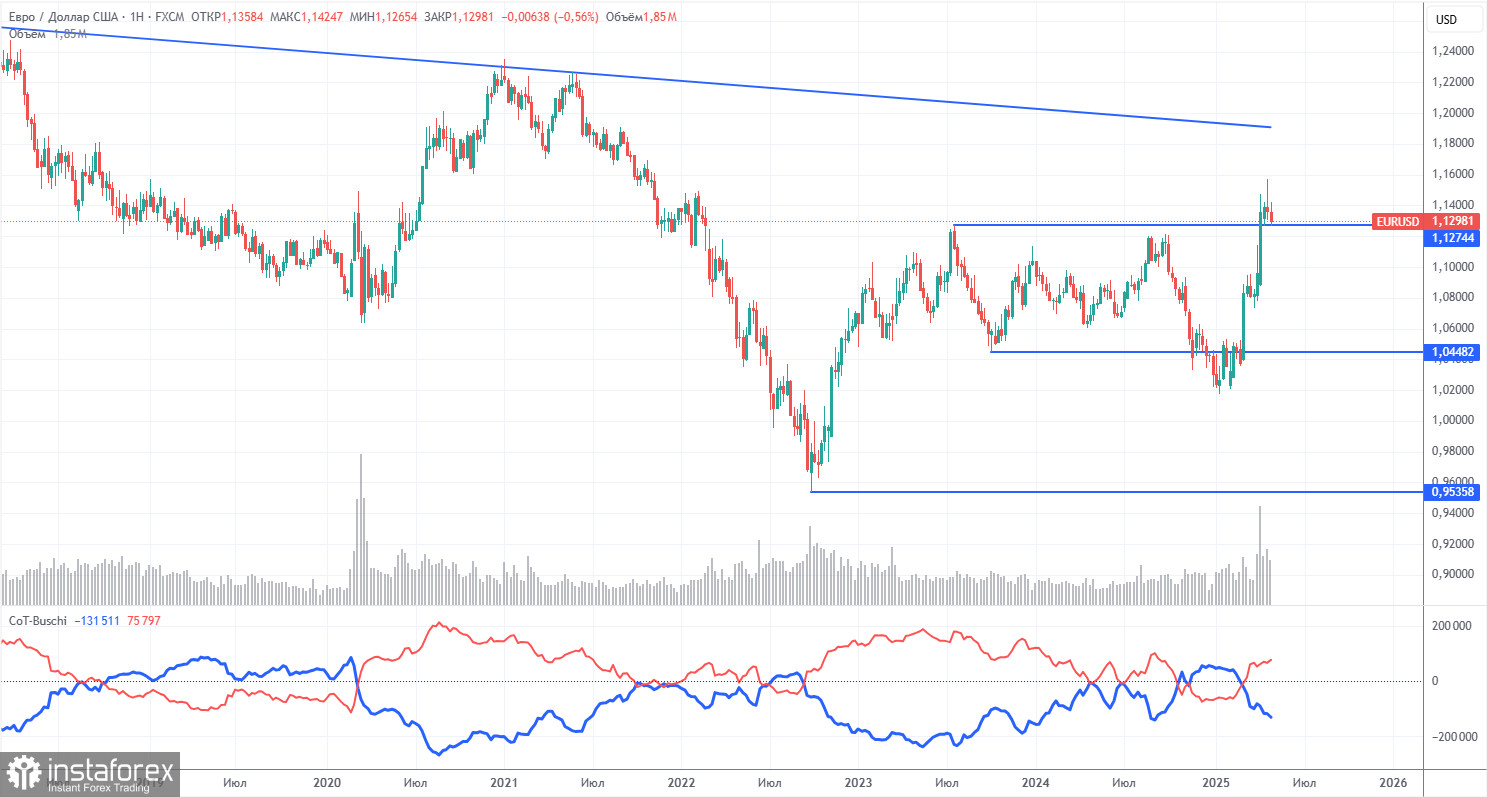
COT Report

This image is no longer relevant

The latest Commitment of Traders (COT) report is dated April 29. The chart above clearly shows that the net position of non-commercial traders has remained bullish for a long time. Bears barely managed to gain the upper hand but quickly lost it. Since Donald Trump took office, the dollar has been on a steep decline. We cannot definitively say that this decline will continue indefinitely, and the COT reports reflect the sentiment of large players—which, under the current circumstances, can change very quickly.

Still, we continue to see no fundamental reasons for the euro to strengthen, while the dollar does have one significant reason to decline. The pair may continue to correct for a few more weeks or months, but the 16-year downtrend for the U.S. currency is unlikely to end so easily.

The red and blue lines have crossed again, signaling a bullish market trend. Over the last reporting week, long positions among non-commercial traders increased by 200, while short positions dropped by 10,600. As a result, the net position grew by 10,400 thousand contracts.

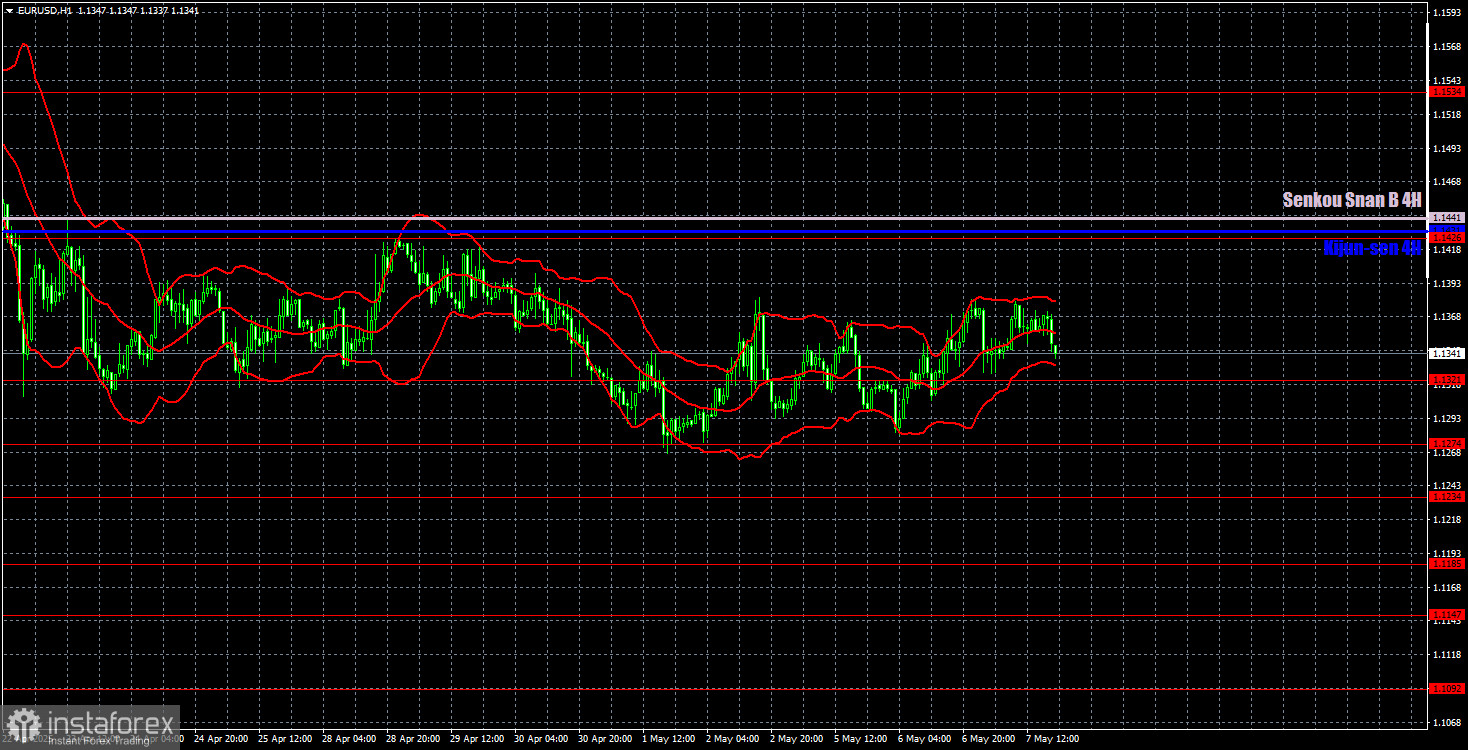
EUR/USD 1-Hour Analysis

This image is no longer relevant

On the hourly timeframe, EUR/USD maintains a general upward trend but has been moving sideways for several weeks amid a lack of updates regarding Trump's trade maneuvering. There's currently very little logic or technical structure in the pair's movement across any timeframe, and the macroeconomic background exerts almost no influence on price behavior. The market waits for updates on the trade war — either escalation or de-escalation — and won't commit to any direction until such clarity arrives.

Trading levels for May 8: 1.0823, 1.0886, 1.0949, 1.1006, 1.1092, 1.1147, 1.1185, 1.1234, 1.1274, 1.1321, 1.1426, 1.1534, 1.1607, 1.1666, as well as the Senkou Span B (1.1441) and Kijun-sen (1.1431) lines. Note: Ichimoku indicator lines may shift during the day, which must be considered when identifying signals. Always place a Stop Loss at breakeven if the price moves 15 pips in the right direction. This helps avoid losses in case of false signals.

German industrial production data will be released in the Eurozone, and jobless claims are scheduled in the US. In the current market environment, however, both reports are largely irrelevant. Traders have ignored far more significant data and fundamental developments in recent weeks, so they are unlikely to trigger any meaningful movement.

Illustration Explanations:

  • Support and resistance price levels – thick red lines where movement may end. They are not trading signal sources.
  • Kijun-sen and Senkou Span B lines—These are strong Ichimoku indicator lines transferred to the hourly timeframe from the 4-hour one.
  • Extremum levels – thin red lines where the price has previously rebounded. These act as trading signal sources.
  • Yellow lines – trend lines, trend channels, and other technical patterns.
  • COT Indicator 1 on the charts – the size of the net position for each category of traders.
Paolo Greco,
Analytical expert of InstaForex
© 2007-2025
Select timeframe
5
min
15
min
30
min
1
hour
4
hours
1
day
1
week
Earn on cryptocurrency rate changes with InstaForex
Download MetaTrader 4 and open your first trade
  • Grand Choice
    Contest by
    InstaForex
    InstaForex always strives to help you
    fulfill your biggest dreams.
    JOIN CONTEST

Recommended Stories

How to Trade the GBP/USD Pair on June 19? Simple Tips and Trade Analysis for Beginners

Analysis of Wednesday's Trades 1H Chart of GBP/USD On Wednesday, the GBP/USD pair spent most of the day in a minimal upward movement, clearly awaiting the outcome of the Federal

Paolo Greco 06:34 2025-06-19 UTC+2

How to Trade the EUR/USD Pair on June 19? Simple Tips and Trade Analysis for Beginners

Analysis of Wednesday's Trades 1H Chart of EUR/USD On Wednesday, the EUR/USD currency pair generally continued trading downward. However, the U.S. dollar only resumed its rise after the results

Paolo Greco 06:34 2025-06-19 UTC+2

Trading Recommendations and Analysis for GBP/USD on June 19: The First Stress Test Passed

On Wednesday, the GBP/USD currency pair recovered throughout the day following Tuesday's sharp decline. The drop in the British pound was likely linked to the possible involvement of the U.S

Paolo Greco 04:02 2025-06-19 UTC+2

Trading Recommendations and Analysis for EUR/USD on June 19: The Euro Prepares for a New Rally

As expected, the EUR/USD currency pair began recovering after Tuesday's decline. As previously noted in today's articles, we are not evaluating the outcome of the Federal Reserve meeting

Paolo Greco 04:02 2025-06-19 UTC+2

GBP/USD: Trading Plan for the U.S. Session on June 18th (Review of Morning Trades)

In my morning forecast, I focused on the 1.3472 level and planned to base market entries around it. Let's examine the 5-minute chart and analyze what happened. The upward move

Miroslaw Bawulski 18:37 2025-06-18 UTC+2

EUR/USD: Trading Plan for the U.S. Session on June 18th (Review of Morning Trades)

In my morning forecast, I highlighted the 1.1499 level and planned to base market entry decisions around it. Let's look at the 5-minute chart and break down what happened

Miroslaw Bawulski 18:34 2025-06-18 UTC+2

How to Trade the GBP/USD Pair on June 18? Simple Tips and Trade Analysis for Beginners

On Tuesday, the GBP/USD pair also showed a relatively strong decline in the second half of the day, which could only be attributed to factors that were impossible to predict

Paolo Greco 06:50 2025-06-18 UTC+2

How to Trade the EUR/USD Pair on June 18? Simple Tips and Trade Analysis for Beginners

Analysis of Tuesday's Trades 1H Chart of EUR/USD The EUR/USD currency pair experienced a significant decline on Tuesday, and it is puzzling to understand why the U.S. dollar unexpectedly strengthened

Paolo Greco 06:50 2025-06-18 UTC+2

Trading Recommendations and Analysis for GBP/USD on June 18: Pound Remains in a Flat Range

On Tuesday, the GBP/USD currency pair showed a relatively strong intraday decline, although there were no real reasons for it. In fact, the macroeconomic data from the U.S. was weak

Paolo Greco 03:56 2025-06-18 UTC+2

Trading Recommendations and Analysis for EUR/USD on June 18: The Dollar Rises Paradoxically

The EUR/USD currency pair unexpectedly rose during the U.S. trading session on Wednesday. The increase in the U.S. dollar was surprising, as there was no positive news to support it—quite

Paolo Greco 03:56 2025-06-18 UTC+2
Can't speak right now?
Ask your question in the chat.
Widget callback
 

Dear visitor,

Your IP address shows that you are currently located in the USA. If you are a resident of the United States, you are prohibited from using the services of InstaFintech Group including online trading, online transfers, deposit/withdrawal of funds, etc.

If you think you are seeing this message by mistake and your location is not the US, kindly proceed to the website. Otherwise, you must leave the website in order to comply with government restrictions.

Why does your IP address show your location as the USA?

  • - you are using a VPN provided by a hosting company based in the United States;
  • - your IP does not have proper WHOIS records;
  • - an error occurred in the WHOIS geolocation database.

Please confirm whether you are a US resident or not by clicking the relevant button below. If you choose the wrong option, being a US resident, you will not be able to open an account with InstaForex anyway.

We are sorry for any inconvenience caused by this message.