empty
17.07.2025 11:15 AM
GBP/USD. July 17th. Unemployment in the UK Continues to Rise

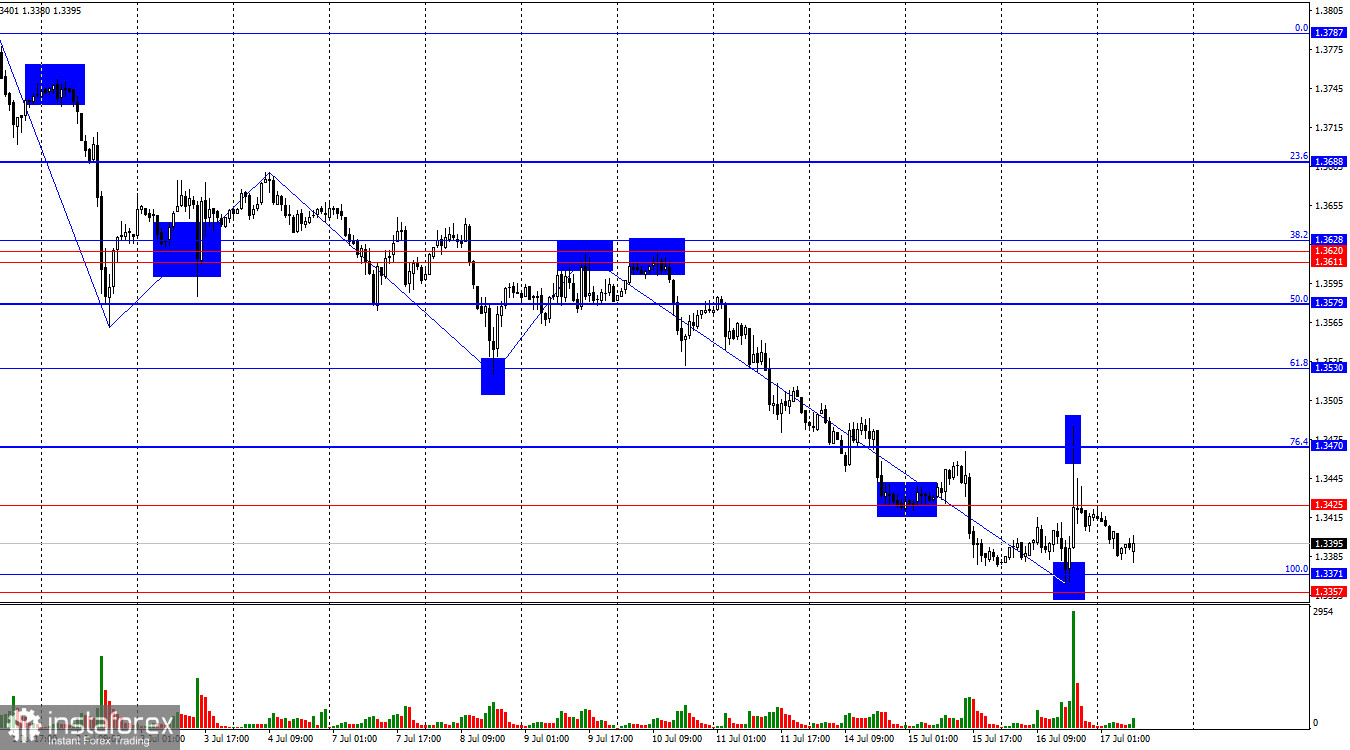
On the hourly chart, the GBP/USD pair rebounded on Wednesday from the support zone of 1.3357–1.3371 and rose to the 76.4% corrective level at 1.3470. A rebound from 1.3470 led to a reversal in favor of the U.S. dollar and a renewed decline toward the 1.3357–1.3371 zone. A new rebound from this zone would again support the pound and lead to growth toward 1.3425 and 1.3470. A firm move below the 1.3357–1.3371 zone would increase the likelihood of a further decline toward the next Fibonacci level of 127.2% at 1.3259.

This image is no longer relevant

The wave structure has shifted in favor of the bears. Several downward waves have formed, each breaking below the low of the previous wave. At the moment, the decline continues, and the pound may breach the key support zone of 1.3357–1.3371. A move below this would definitively establish a bearish trend, as the low from the June 23 wave would be broken. Despite the mixed news background, the bears have regained confidence recently.

Yesterday, the UK released its inflation report, which traders openly ignored. Inflation in the UK increased in June, contrary to traders' expectations. A rise in inflation reduces the likelihood of the Bank of England easing monetary policy in the near term, so a stronger pound would have been the logical market reaction. However, the report was overlooked. Today, several other UK statistics were also published, with two key indicators standing out. The unemployment rate rose from 4.6% to 4.7%, and the number of unemployed increased by 26,000, compared to market expectations of around 18,000. As we can see, two of the most important reports turned out to be weak, triggering renewed bearish pressure. In my view, the market is currently filtering incoming data very selectively and is ignoring many reports. Nevertheless, the chart clearly indicates where the market is headed next. As long as the pair is trading above the 1.3357–1.3371 zone, all is not yet lost for the bulls.

This image is no longer relevant

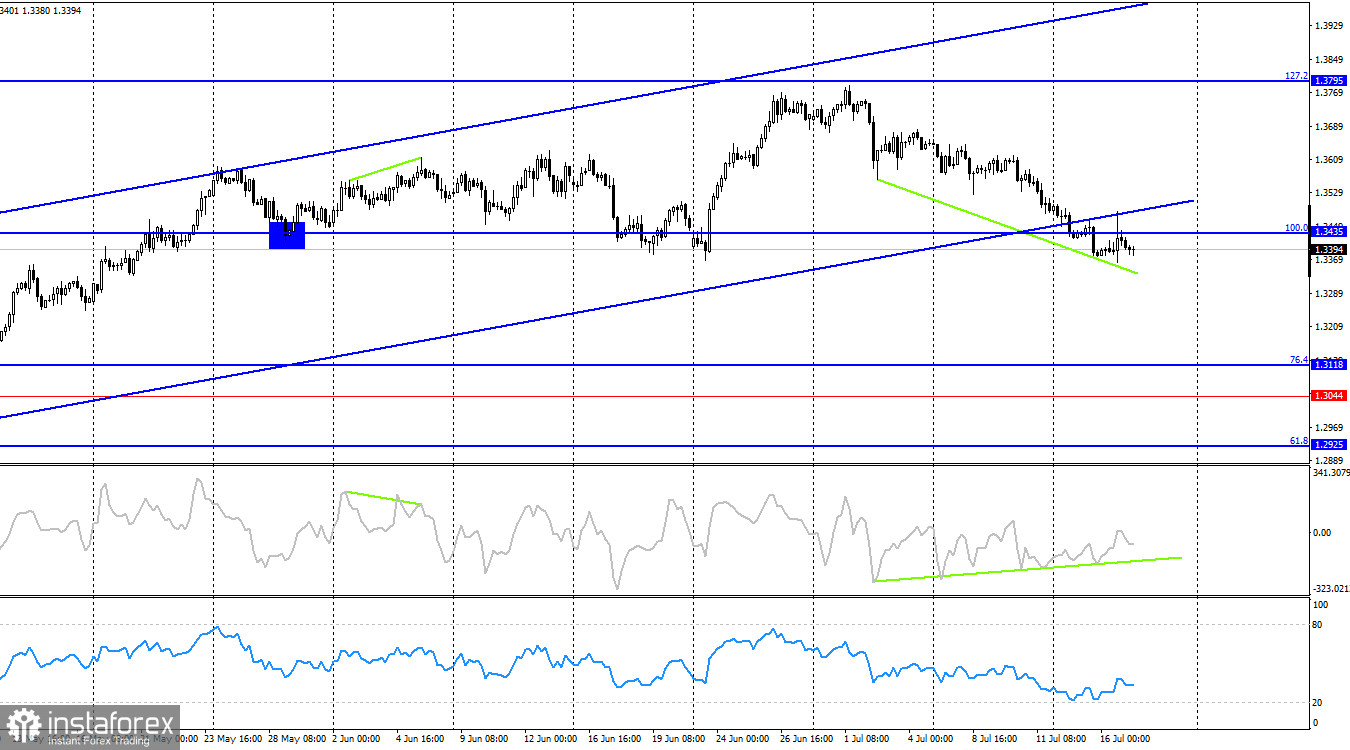
On the 4-hour chart, the pair has turned in favor of the U.S. dollar and continues to decline. This week, it broke below the 100.0% Fibonacci level at 1.3435 and below the ascending trend channel. I remain cautious about declaring a bearish trend, as there is still very little positive news from the U.S. I can allow for a correction, but not a full-fledged bearish trend. Technically, the decline may continue toward the next corrective level of 76.4% at 1.3118.

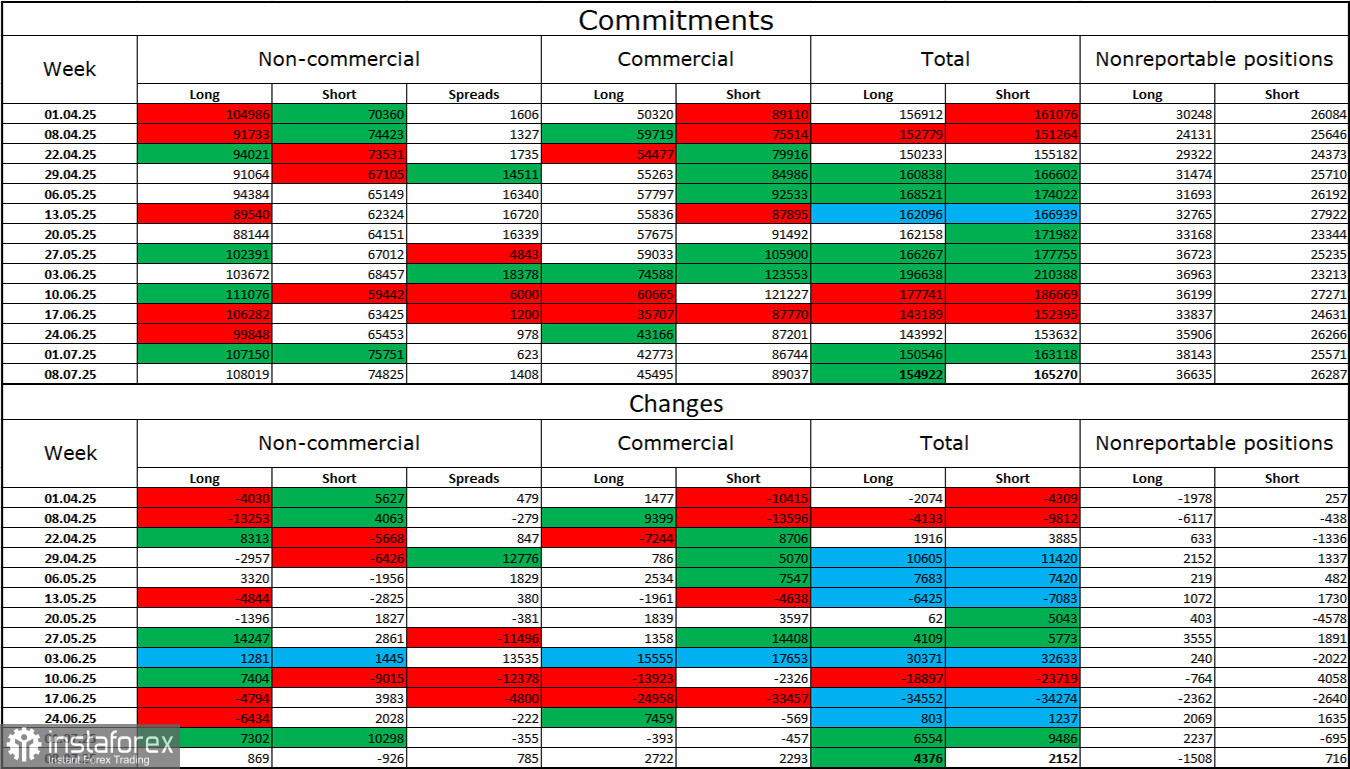
Commitments of Traders (COT) Report:

This image is no longer relevant

The sentiment among the "Non-commercial" trader category became slightly less bullish over the last reporting week. The number of long positions held by speculators increased by 7,302, while the number of short positions rose by 10,298. However, the bears have long since lost their advantage and stand no chance of success. The gap between long and short positions is 32,000 in favor of the bulls: 107,000 versus 75,000.

In my view, the pound still faces downside risks, but the events of 2025 have completely shifted the market's long-term outlook. Over the past four months, the number of long positions has risen from 65,000 to 107,000, while short positions have fallen from 76,000 to 75,000. Under Donald Trump, confidence in the dollar has weakened, and the COT reports show that traders have little appetite to buy it. Thus, regardless of the general news background, the dollar continues to decline amid the developments surrounding Trump.

News Calendar for the U.S. and the U.K.:

  • UK – Unemployment Rate (06:00 UTC)
  • UK – Change in Claimant Count (06:00 UTC)
  • UK – Average Hourly Earnings (06:00 UTC)
  • U.S. – Retail Sales Change (12:30 UTC)
  • U.S. – Initial Jobless Claims (12:30 UTC)

Thursday's economic calendar includes five entries, three of which have already been released. The impact of the remaining news on market sentiment for the rest of the day is expected to be limited.

GBP/USD Forecast and Trader Advice:

I do not recommend opening new short positions today, as the dollar has already exceeded its expected move. Long positions can be considered upon a rebound from the 1.3357–1.3371 zone, with targets at 1.3425 and 1.3470. Yesterday, a similar signal brought good profits.

Fibonacci level grids are built from 1.3371–1.3787 on the hourly chart and from 1.3431–1.2104 on the 4-hour chart.

Samir Klishi,
Analytical expert of InstaForex
© 2007-2025
Summary
Urgency
Analytic
Grigory Sokolov
Start trade
Earn on cryptocurrency rate changes with InstaForex
Download MetaTrader 4 and open your first trade
  • Grand Choice
    Contest by
    InstaForex
    InstaForex always strives to help you
    fulfill your biggest dreams.
    JOIN CONTEST

Recommended Stories

EUR/USD Forecast for July 25, 2025

At the very last moment, the euro released the tension and abandoned its attempt to retest the upper boundary of the price channel. The day closed below the daily MACD

Laurie Bailey 05:06 2025-07-25 UTC+2

GBP/USD Forecast for July 25, 2025

The British pound failed to overcome the pressure of the daily balance line. Yesterday, the price fell by 69 pips, and this decline continued into the morning. The signal line

Laurie Bailey 05:06 2025-07-25 UTC+2

USD/JPY Forecast for July 25, 2025

The USD/JPY pair is showing a strong upward trend. After rebounding from the support level at 146.29, the price is now heading toward the nearest target at 149.38. This movement

Laurie Bailey 05:06 2025-07-25 UTC+2

Forex forecast 24/07/2025: EUR/USD, GBP/USD, Gold, Ethereum and Bitcoin

Useful links: My other articles are available in this section InstaForex course for beginners Popular Analytics Open trading account Important: The begginers in forex trading need to be very careful

Sebastian Seliga 12:02 2025-07-24 UTC+2

Forecast for EUR/USD on July 24, 2025

On Wednesday, the EUR/USD pair rebounded from the 127.2% Fibonacci retracement level at 1.1712, reversed in favor of the euro, and continued to rise toward the 1.1802 level. A rebound

Samir Klishi 11:21 2025-07-24 UTC+2

Forecast for GBP/USD on July 24, 2025

On the hourly chart, the GBP/USD pair consolidated above the 61.8% Fibonacci retracement level at 1.3530 on Wednesday and rose to the 50.0% level at 1.3579. Today, a rebound from

Samir Klishi 11:05 2025-07-24 UTC+2

Trading Signals for BITCOIN for July 24-27, 2025: buy above $117,000 (6/8 Murray - 21 SMA)

The eagle indicator has been showing a positive signal since July 21. It is likely that any pullback in Bitcoin in the coming days will be seen as a signal

Dimitrios Zappas 06:25 2025-07-24 UTC+2

Trading Signals for GOLD (XAU/USD) for July 24-27, 2025: sell below $3,400 (21 SMA - 7/8 Murray)

The Eagle indicator is signaling a negative sequence, so we believe that any technical rebound, as long as the price trades below the 8/8 Murray level, will be seen

Dimitrios Zappas 06:23 2025-07-24 UTC+2

Trading Signals for EUR/USD for July 24-27, 2025: buy above 1.1745 (21 SMA - 8/8 Murray)

Technically, the euro is reaching exhaustion levels. In the latest trading, Japanese candlesticks called dojis can be seen on the technical chart, indicating market indecision. A technical correction is likely

Dimitrios Zappas 06:18 2025-07-24 UTC+2

If the support level 6327.24 on S&P 500 Index's can withstand today's downward correction, it will lead to renewed strengthening.Thursday, July 24, 2025.

S&P 500 Index – Thursday, July 24, 2025. With the Golden Cross EMA(50) above the EMA(200), buyers are quite dominant. Although the RSI(14) indicator is at a neutral bullish level

Arief Makmur 05:54 2025-07-24 UTC+2
Can't speak right now?
Ask your question in the chat.
Widget callback
 

Dear visitor,

Your IP address shows that you are currently located in the USA. If you are a resident of the United States, you are prohibited from using the services of InstaFintech Group including online trading, online transfers, deposit/withdrawal of funds, etc.

If you think you are seeing this message by mistake and your location is not the US, kindly proceed to the website. Otherwise, you must leave the website in order to comply with government restrictions.

Why does your IP address show your location as the USA?

  • - you are using a VPN provided by a hosting company based in the United States;
  • - your IP does not have proper WHOIS records;
  • - an error occurred in the WHOIS geolocation database.

Please confirm whether you are a US resident or not by clicking the relevant button below. If you choose the wrong option, being a US resident, you will not be able to open an account with InstaForex anyway.

We are sorry for any inconvenience caused by this message.